1. Columbus Circle
2. D Train
3. Washington Square
4. (Boring) Goodbye To Language
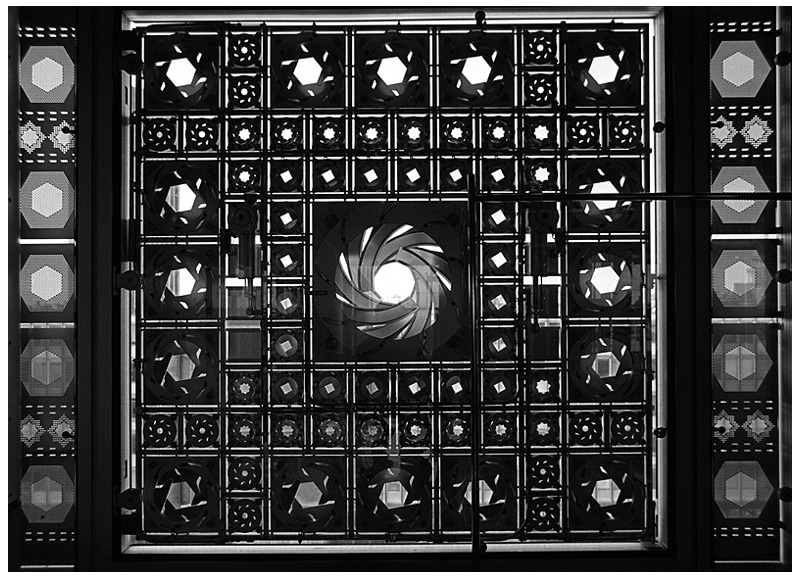
This is a project in which I attempted to create an iris mechanism. I chose it because, besides the aesthetic quality of it, I find its applications very relevant to me. An iris mechanism can be used as an architectural element (as with the mechanical windows at Nouvel’s Arab Institute in Paris shown below), as well as in the context of installations where light and line of sight need to be manipulated somehow.
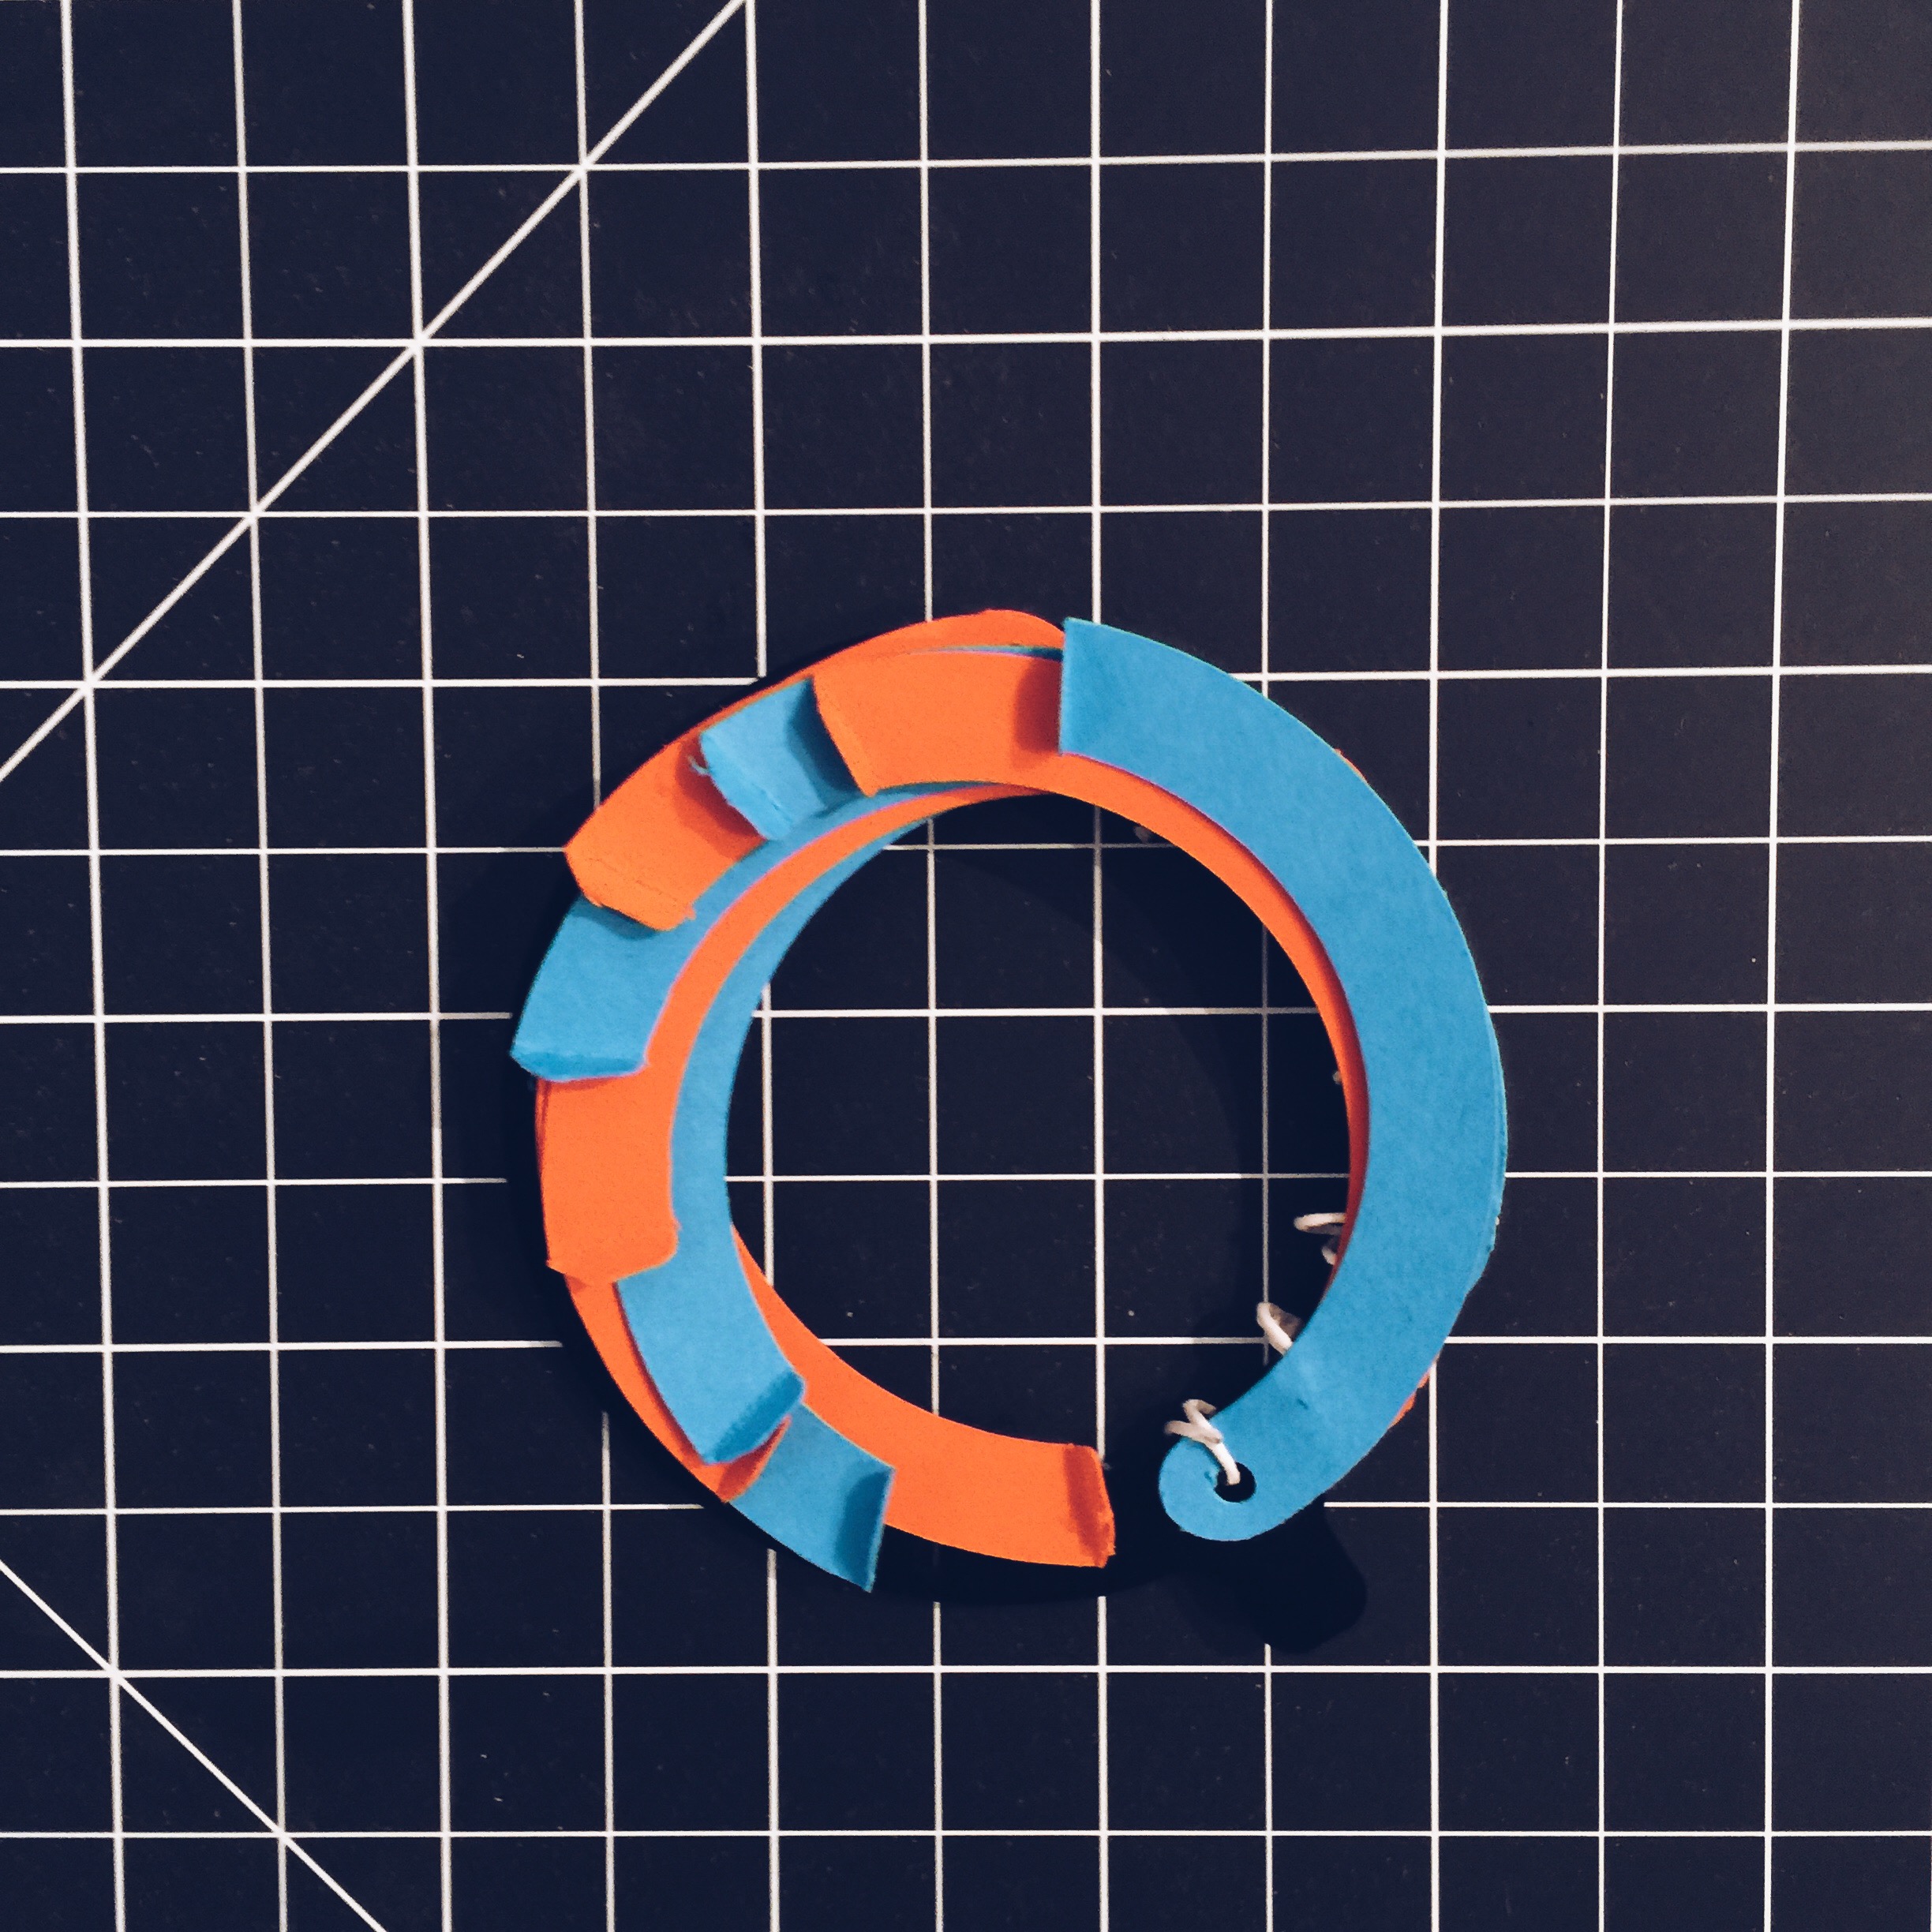
The first prototype I made was to understand the basic structure and the constraints in movement. By following a few guides I read and watched online, I used the vinyl cutter to cut a number of wedges, as well as two different circular parts. The first is what the wedges are attached to. The second has the purpose of constraining a perpendicular part of each wedge so that a simple circular movement provides enough friction for the wedges to open (or close, depending on direction of movement).
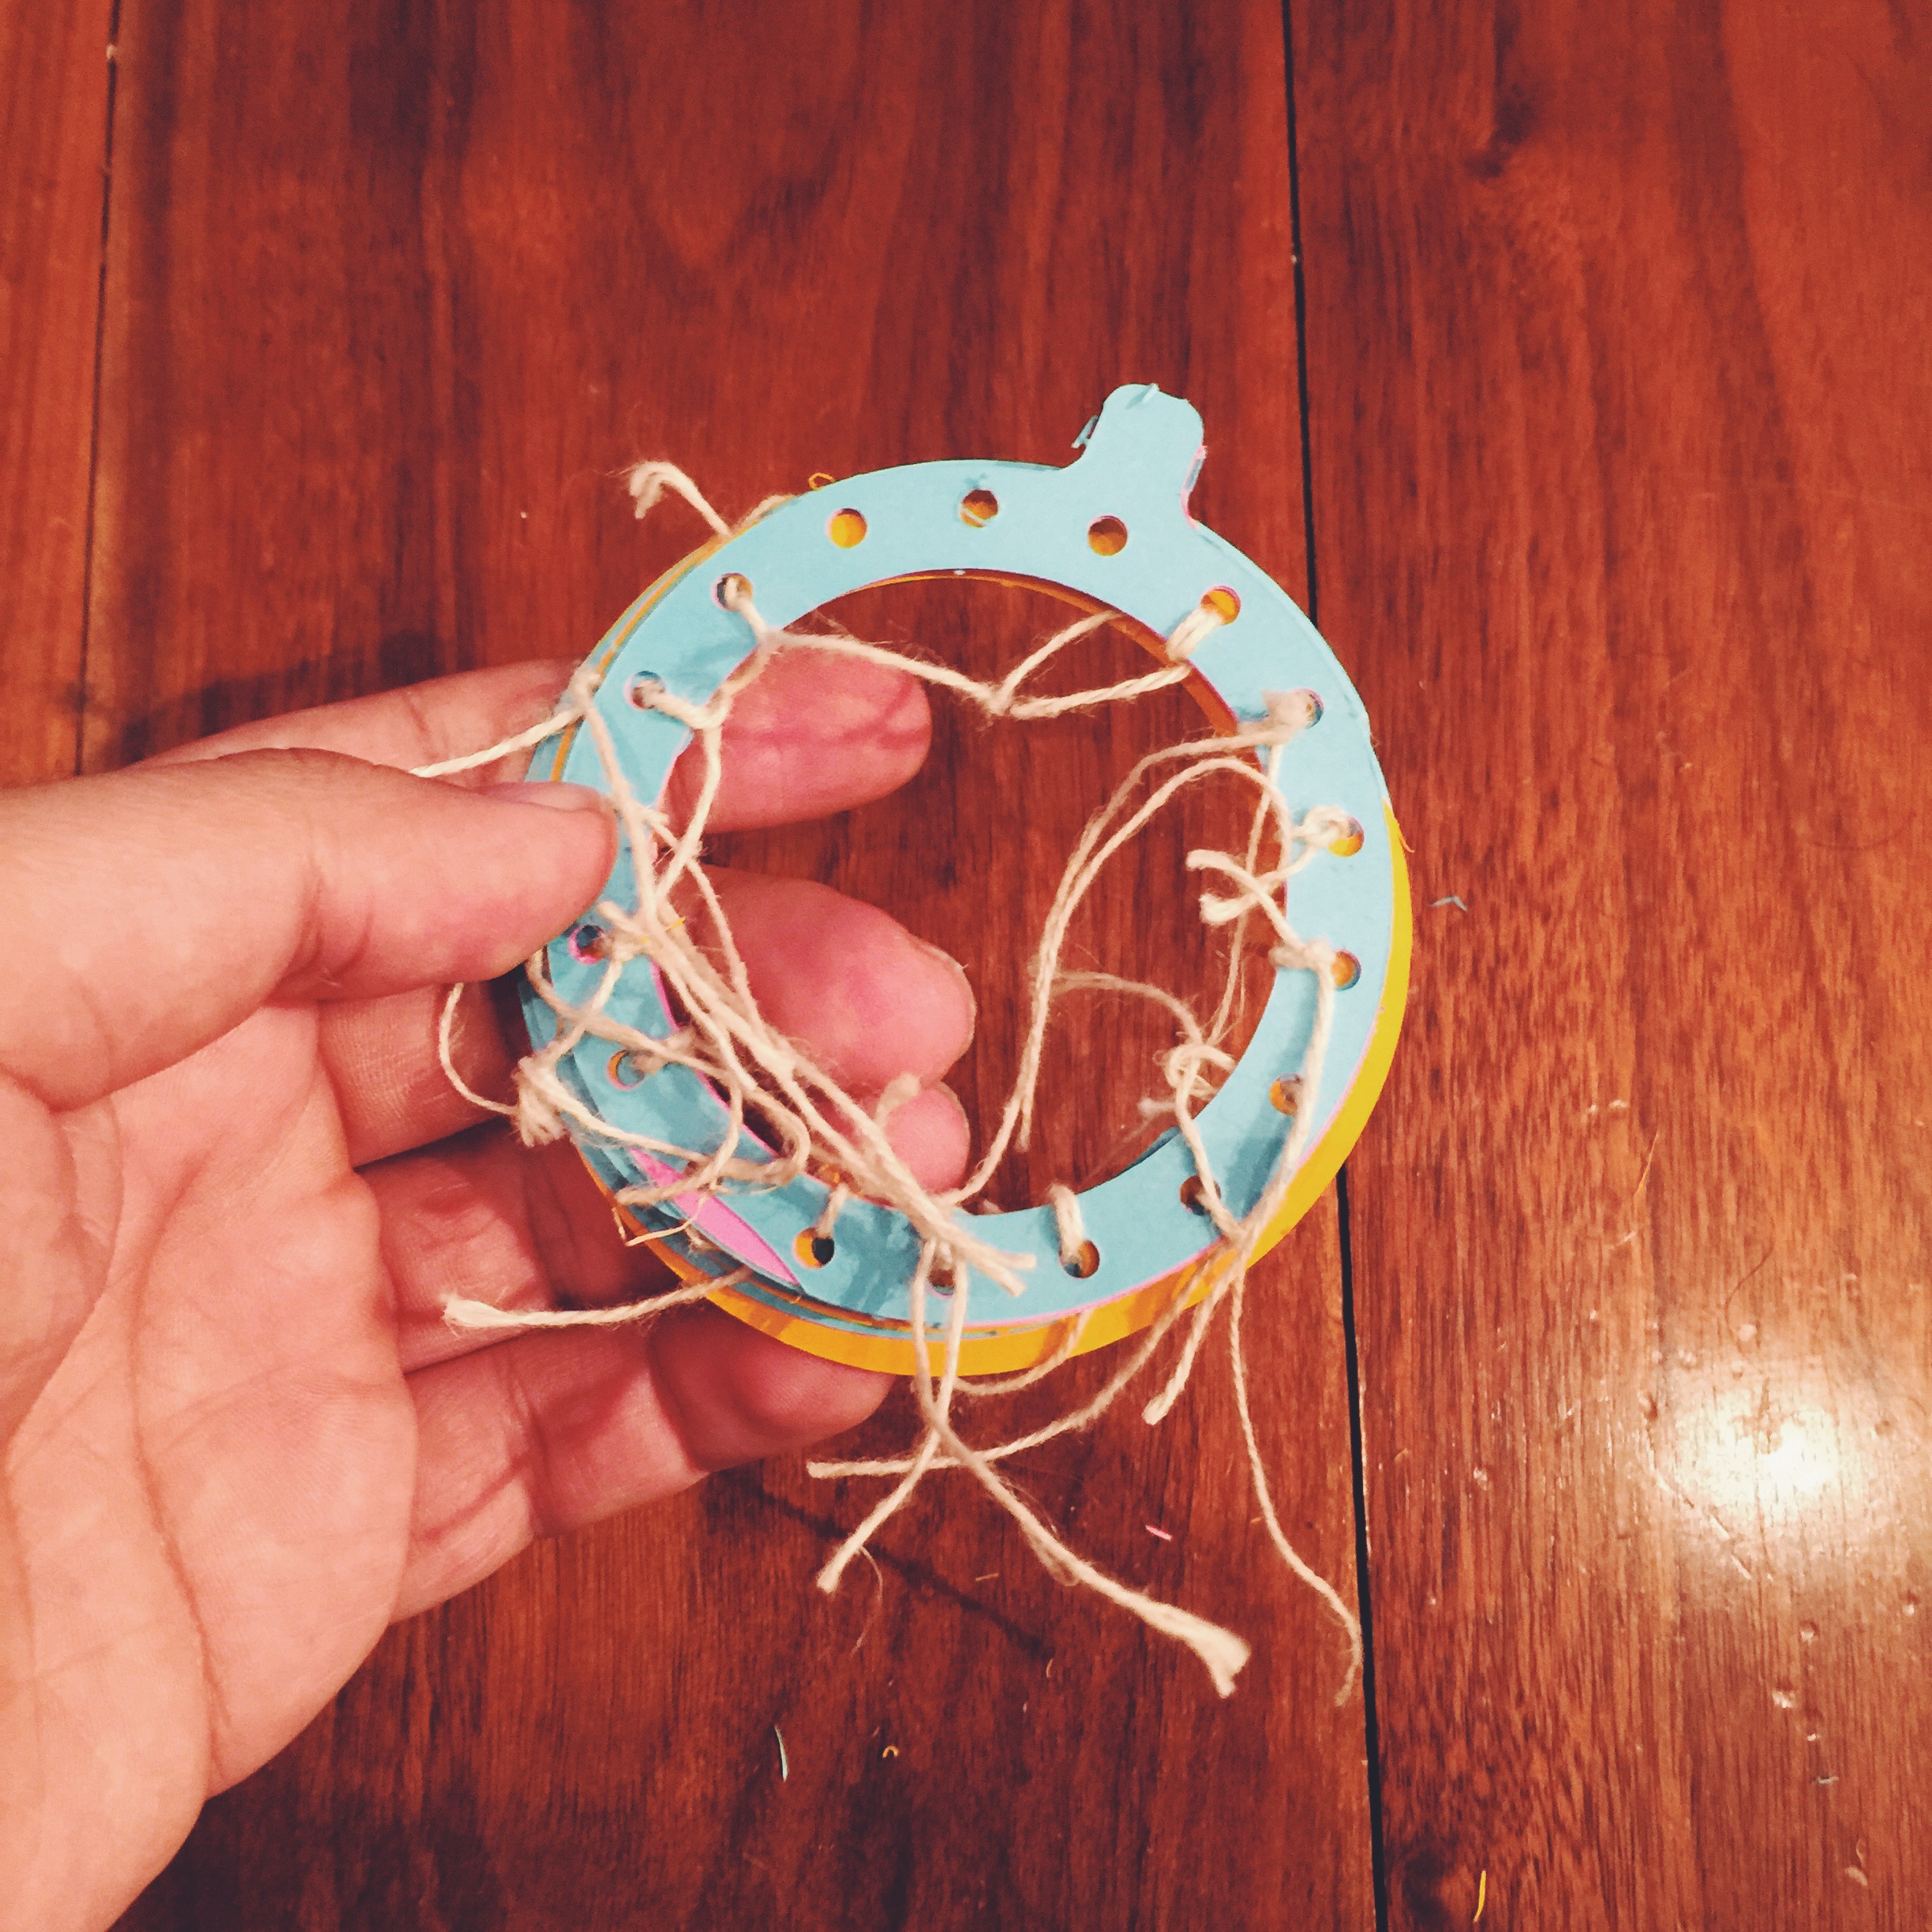
The results where aesthetically acceptable, but functionally, the use of cardstock for the two circular parts resulted in an incorrect behavior. The paper material used is not firm enough to hold the pieces in place, nor to provide the required friction for the opening to occur. In addition, I used hemp threads to fasten the wedges into the frame, which is really hard to work with and to make stay in place.
I attempted to solve the problems with the first prototype by using other materials for both the circular parts, as well as the threads used to keep the wedges in place as a pivot.
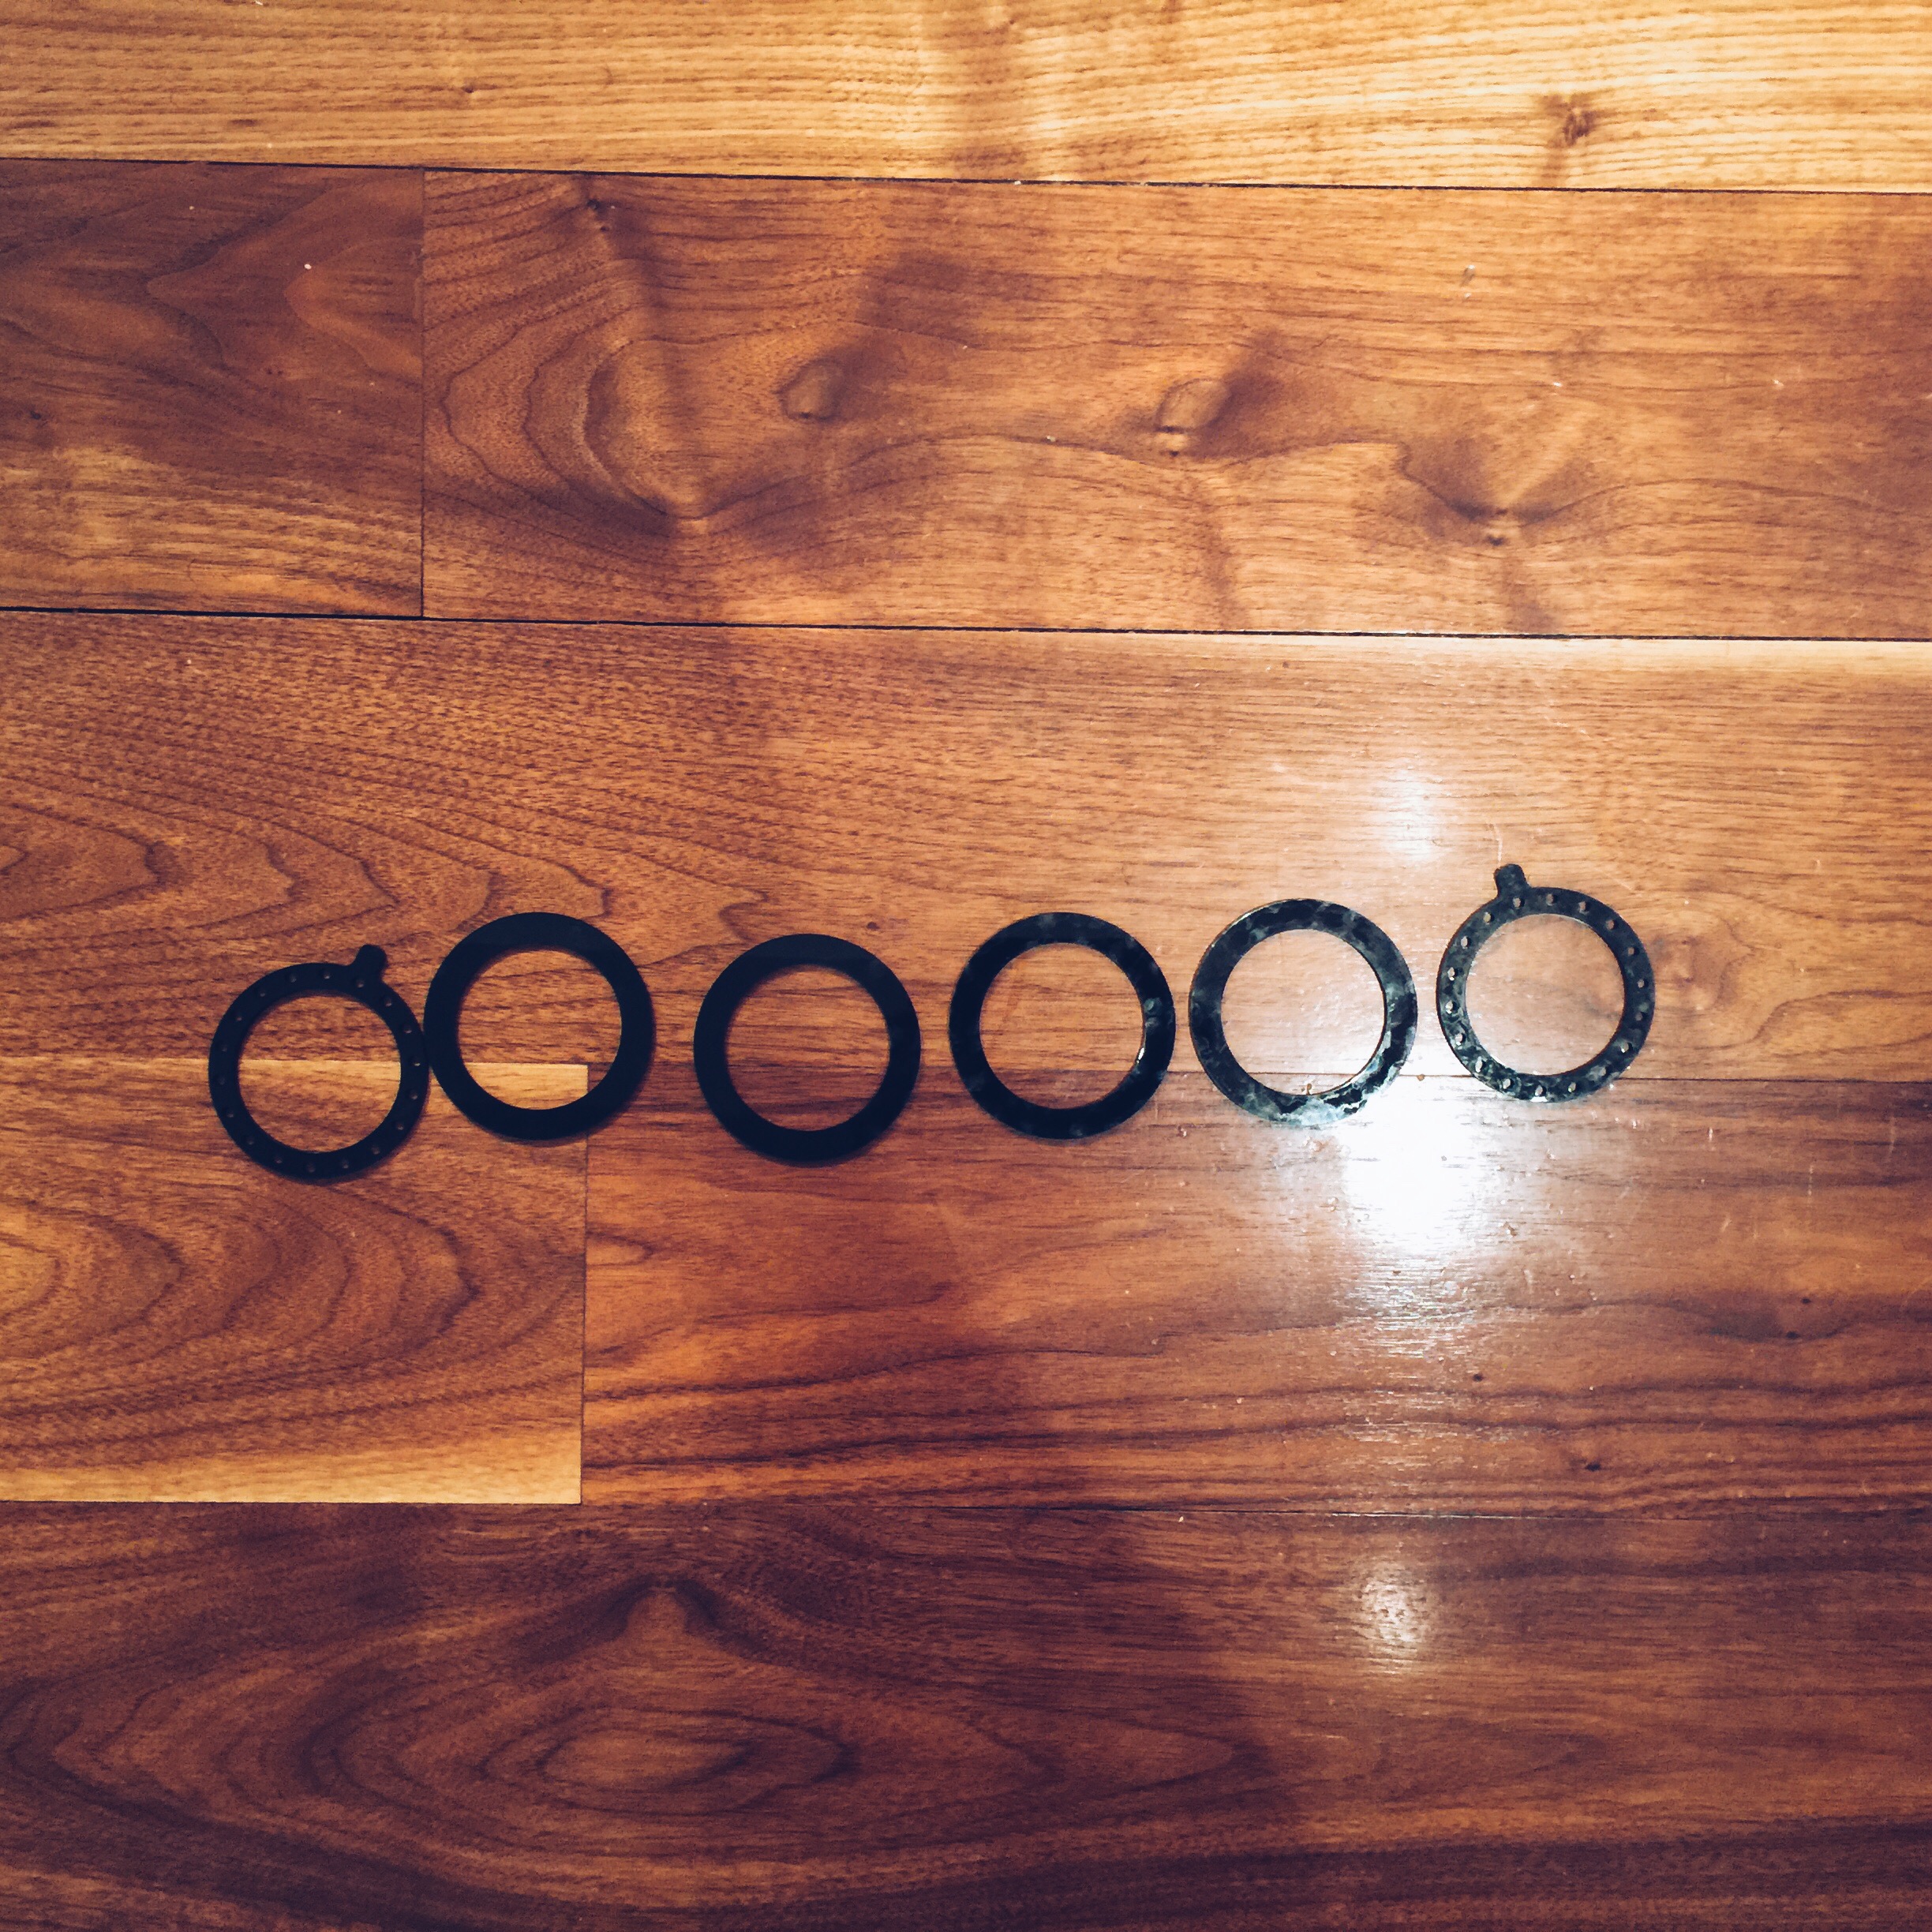
I used relatively thin black acrylic for the circular frames, cutting the pieces using the laser-cutter. I also added a third circular frame type to cover the design from above and below.
The process of placing the wedges is time consuming, but the choice of using malleable wires as fasteners (instead of the hemp threads I used in the previous prototype), made the process much smoother.
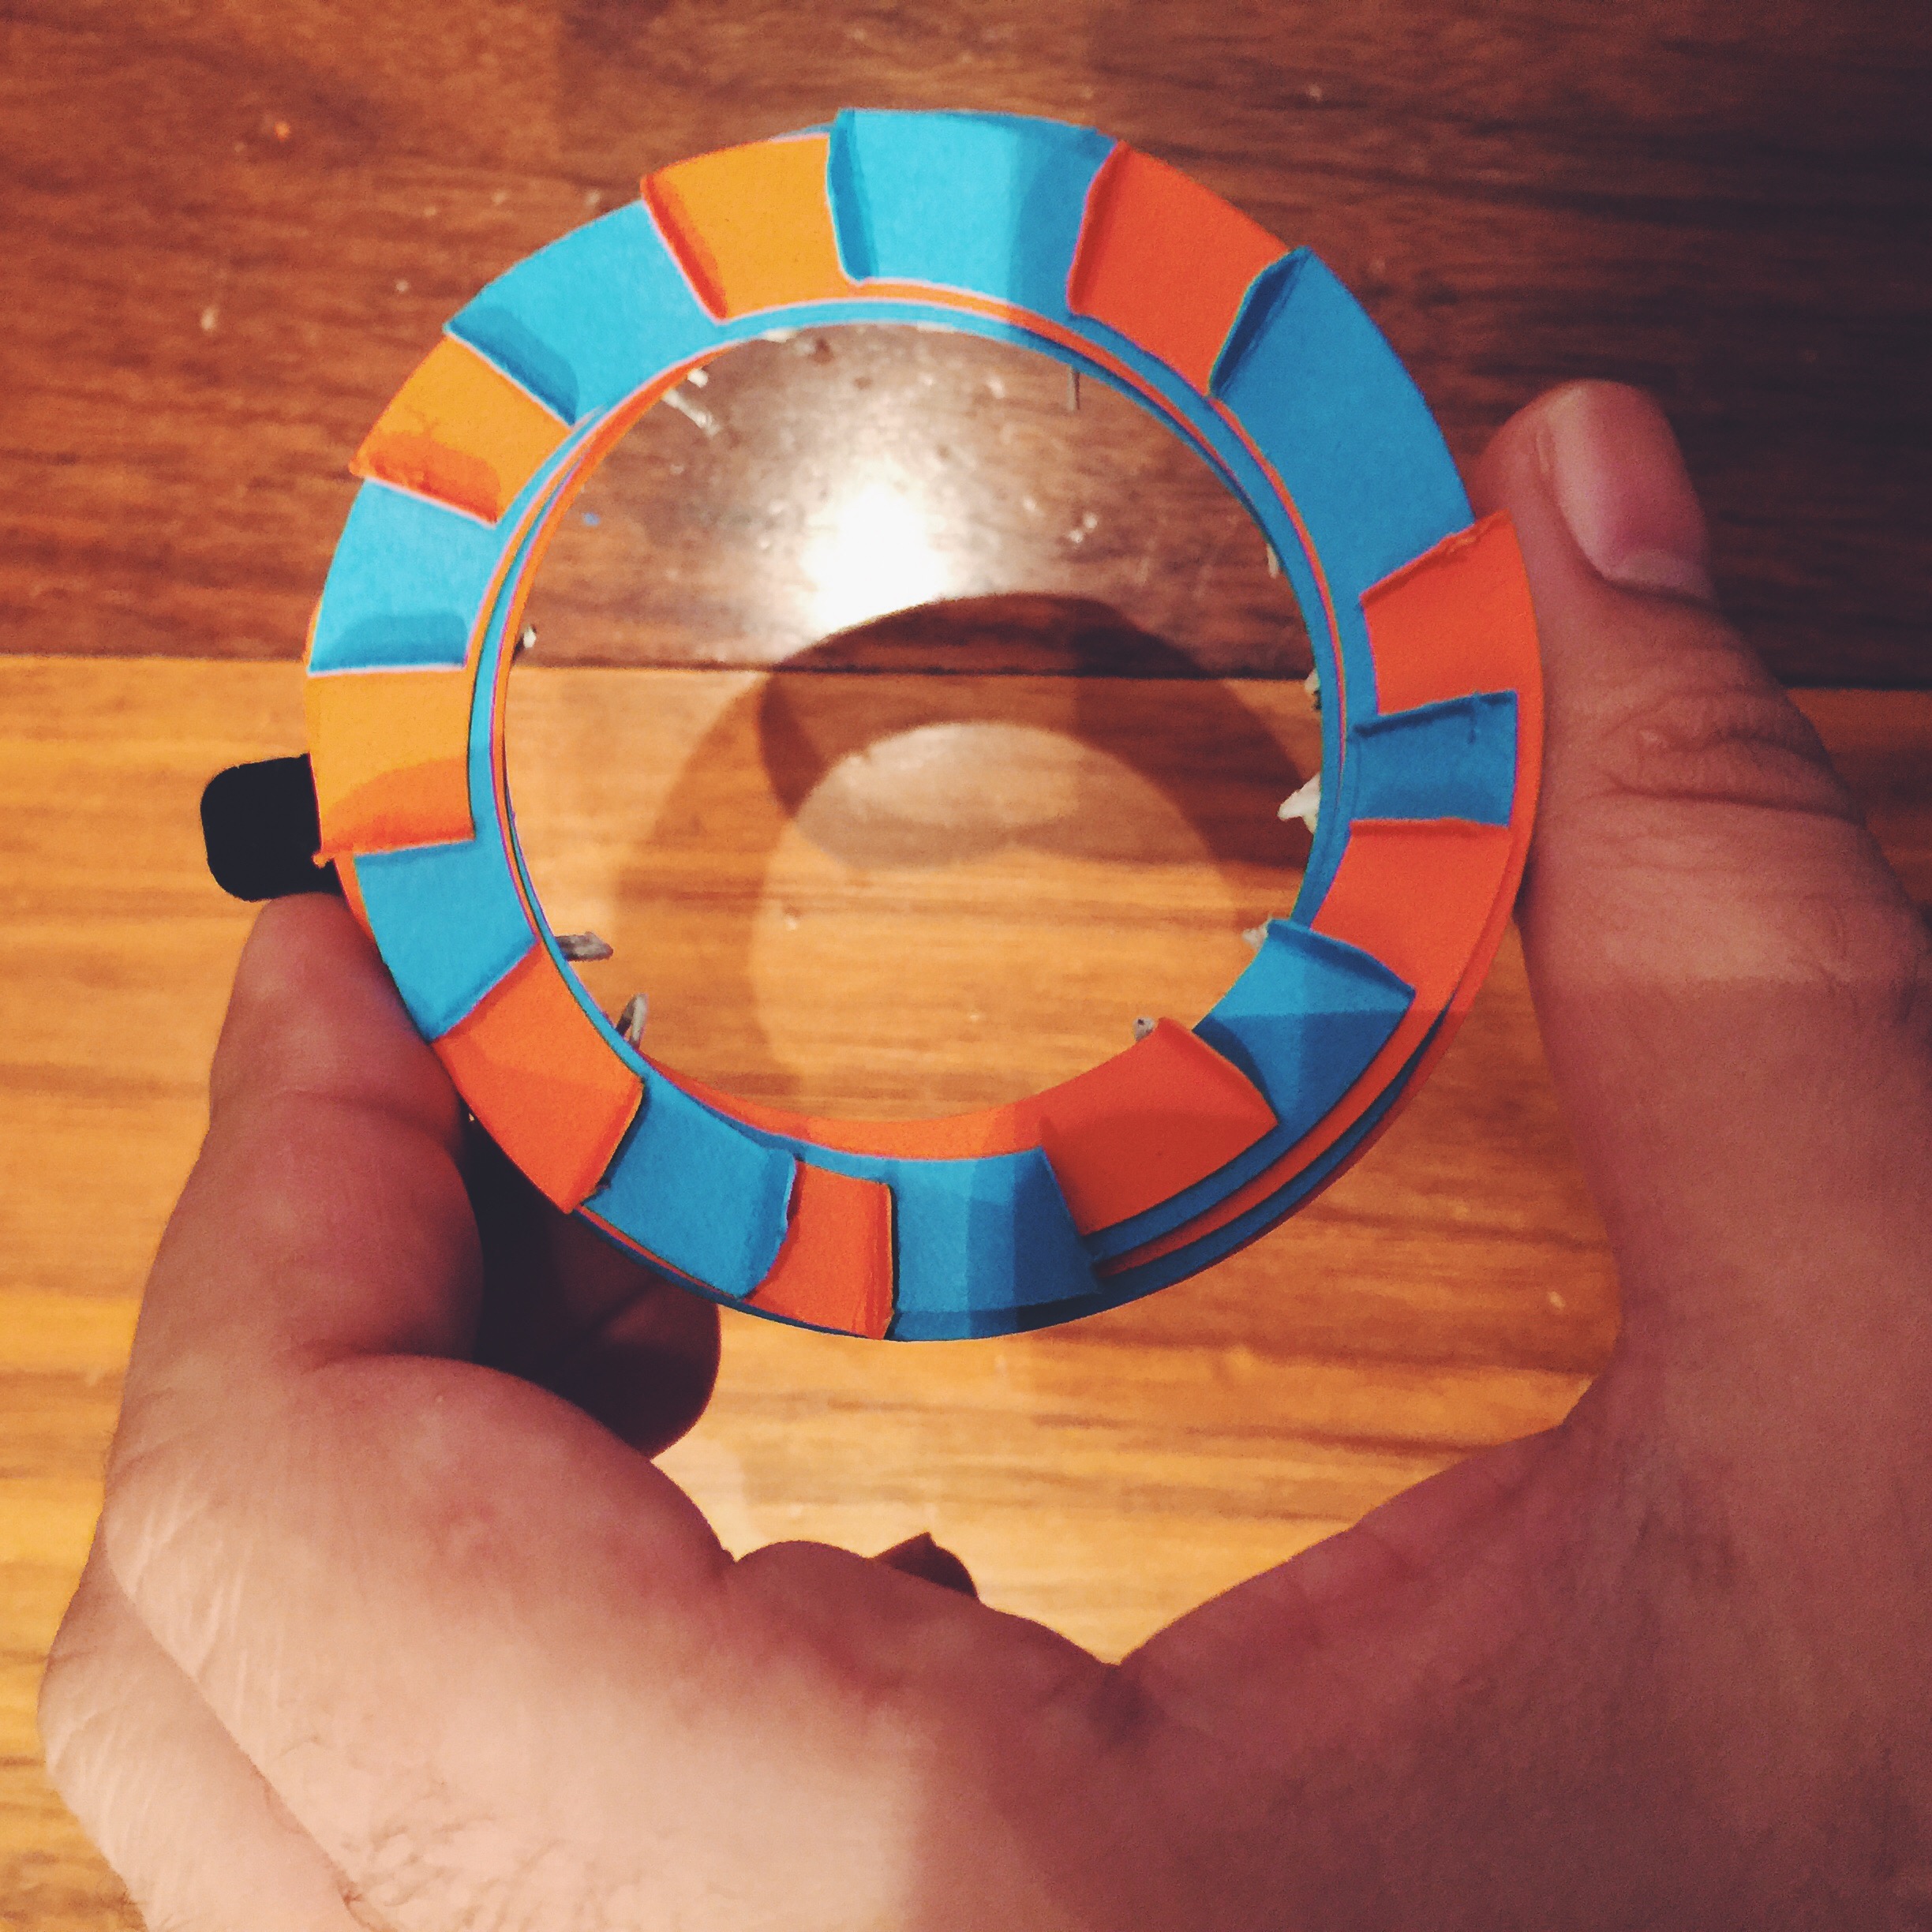
Using the acrylic, laser-cut “friction” frame, the movement was constrained in the way it is supposed to be.
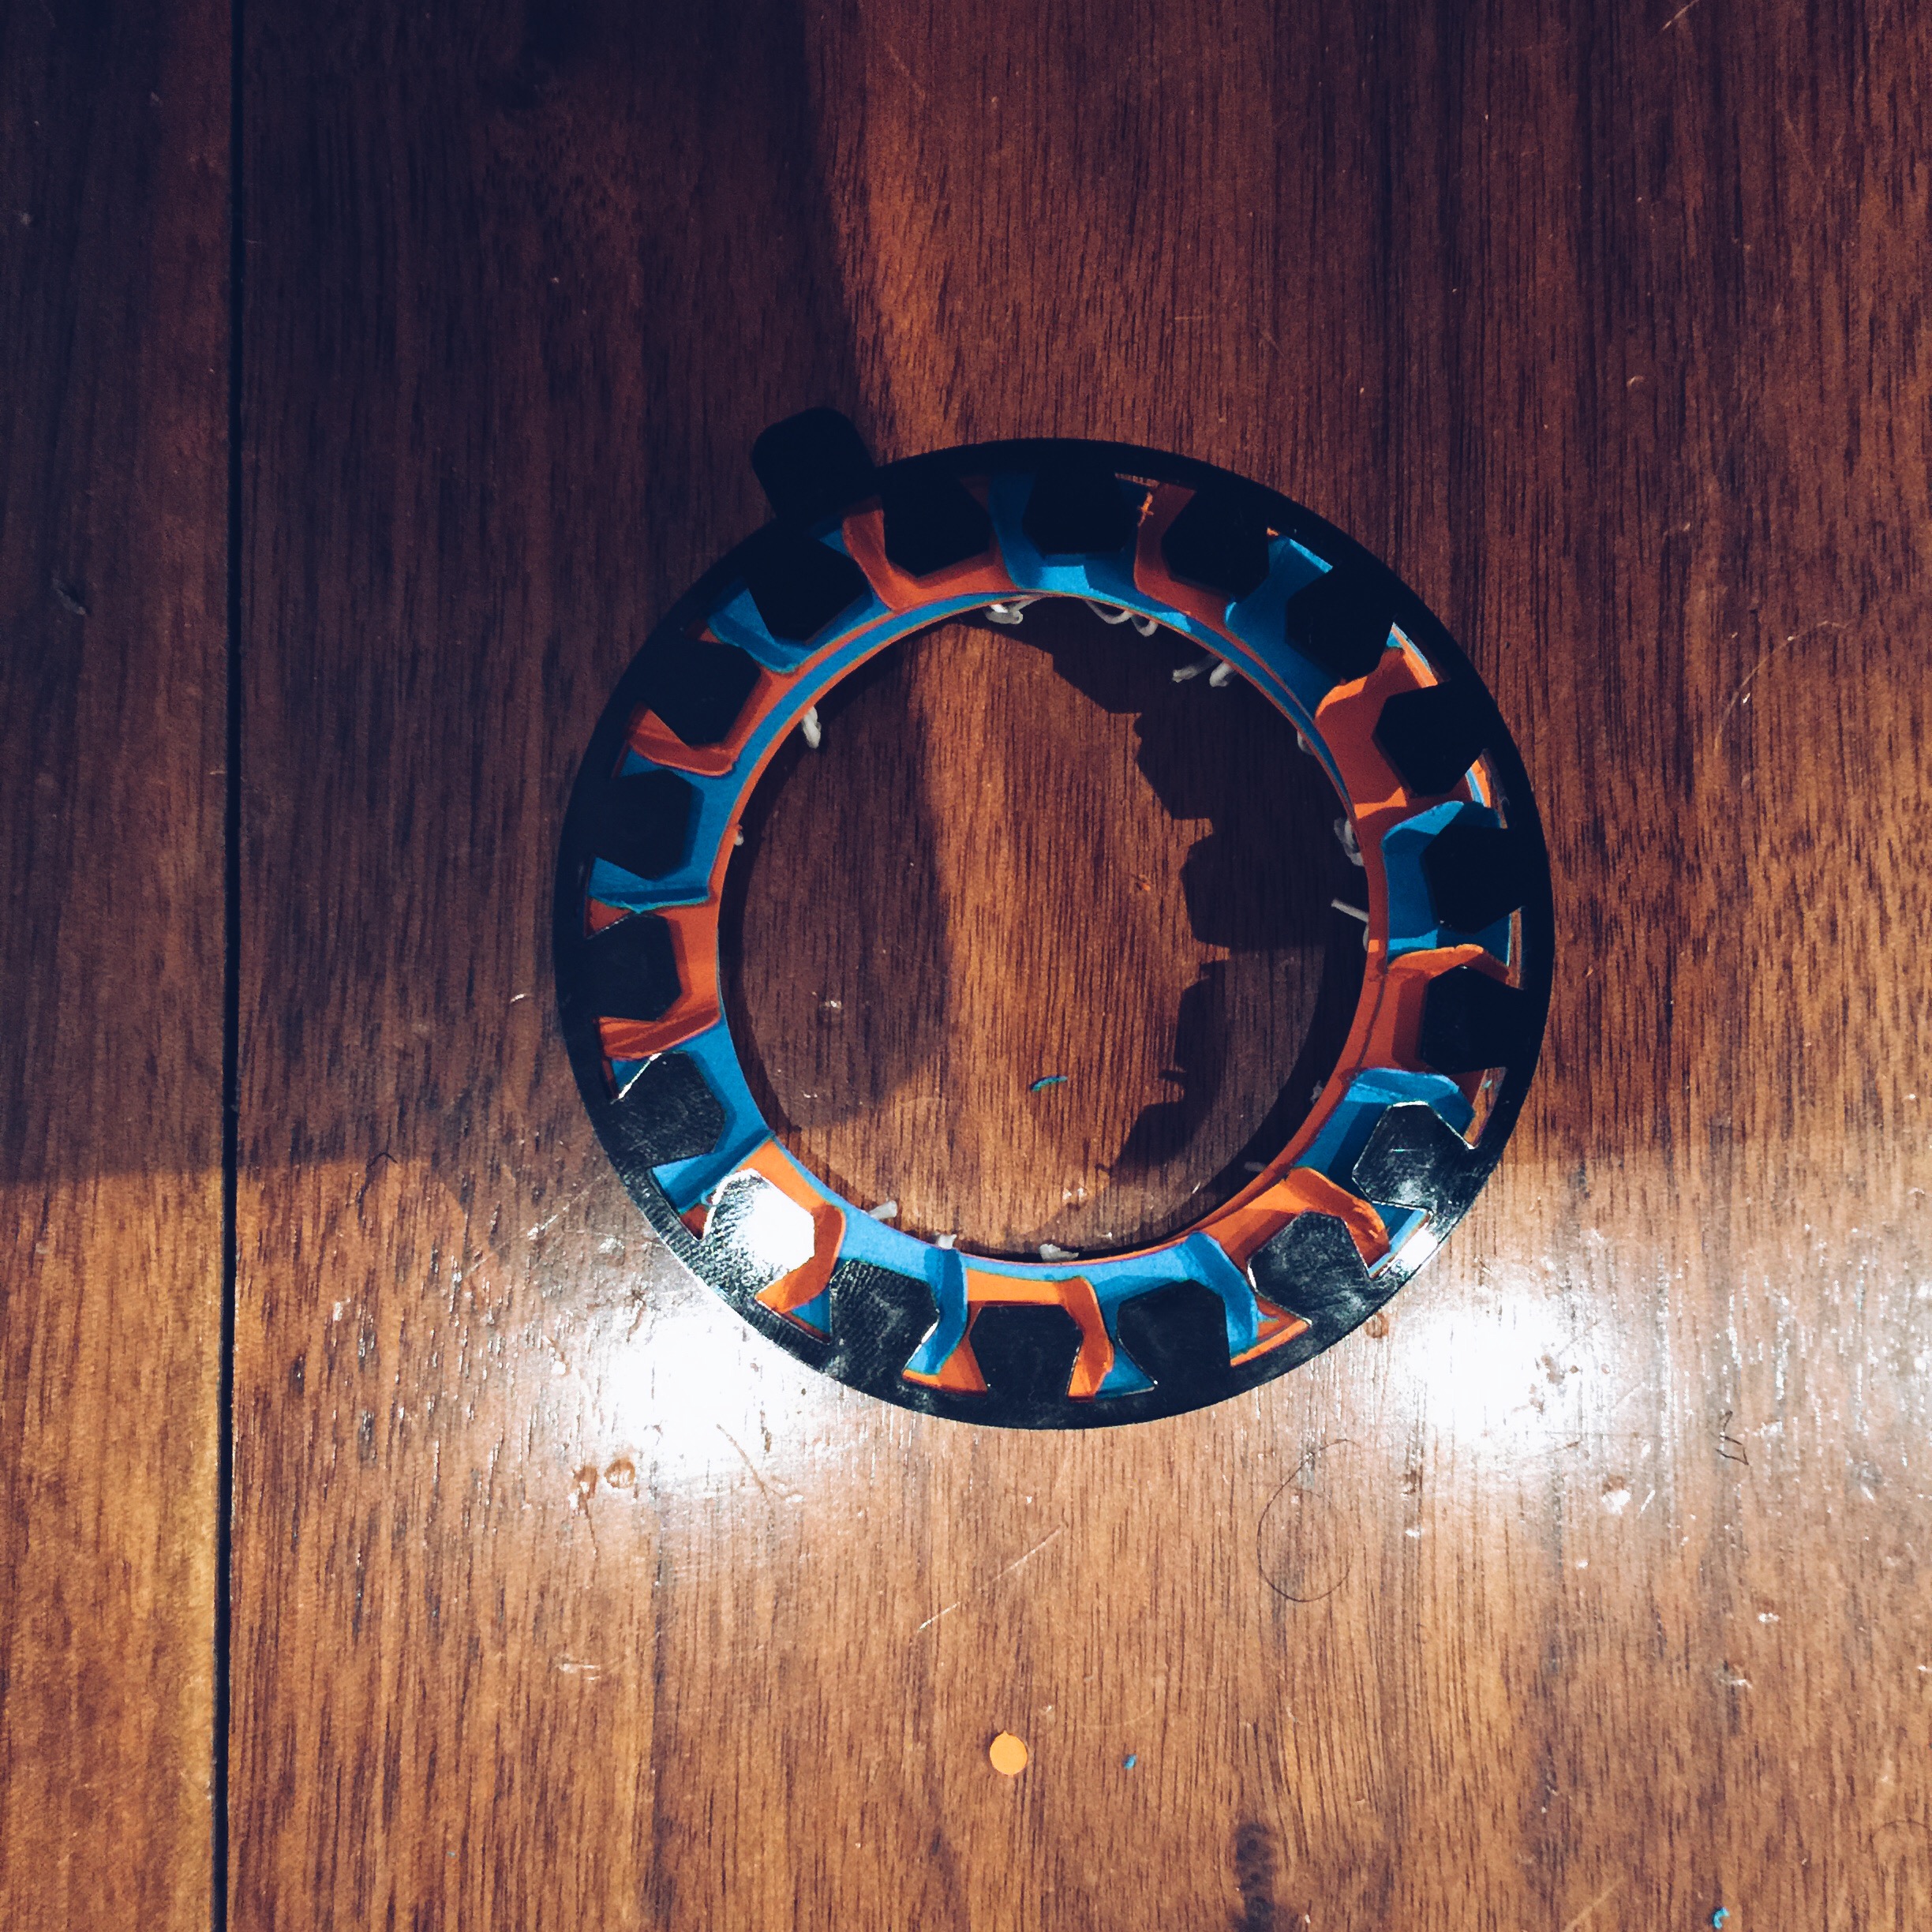
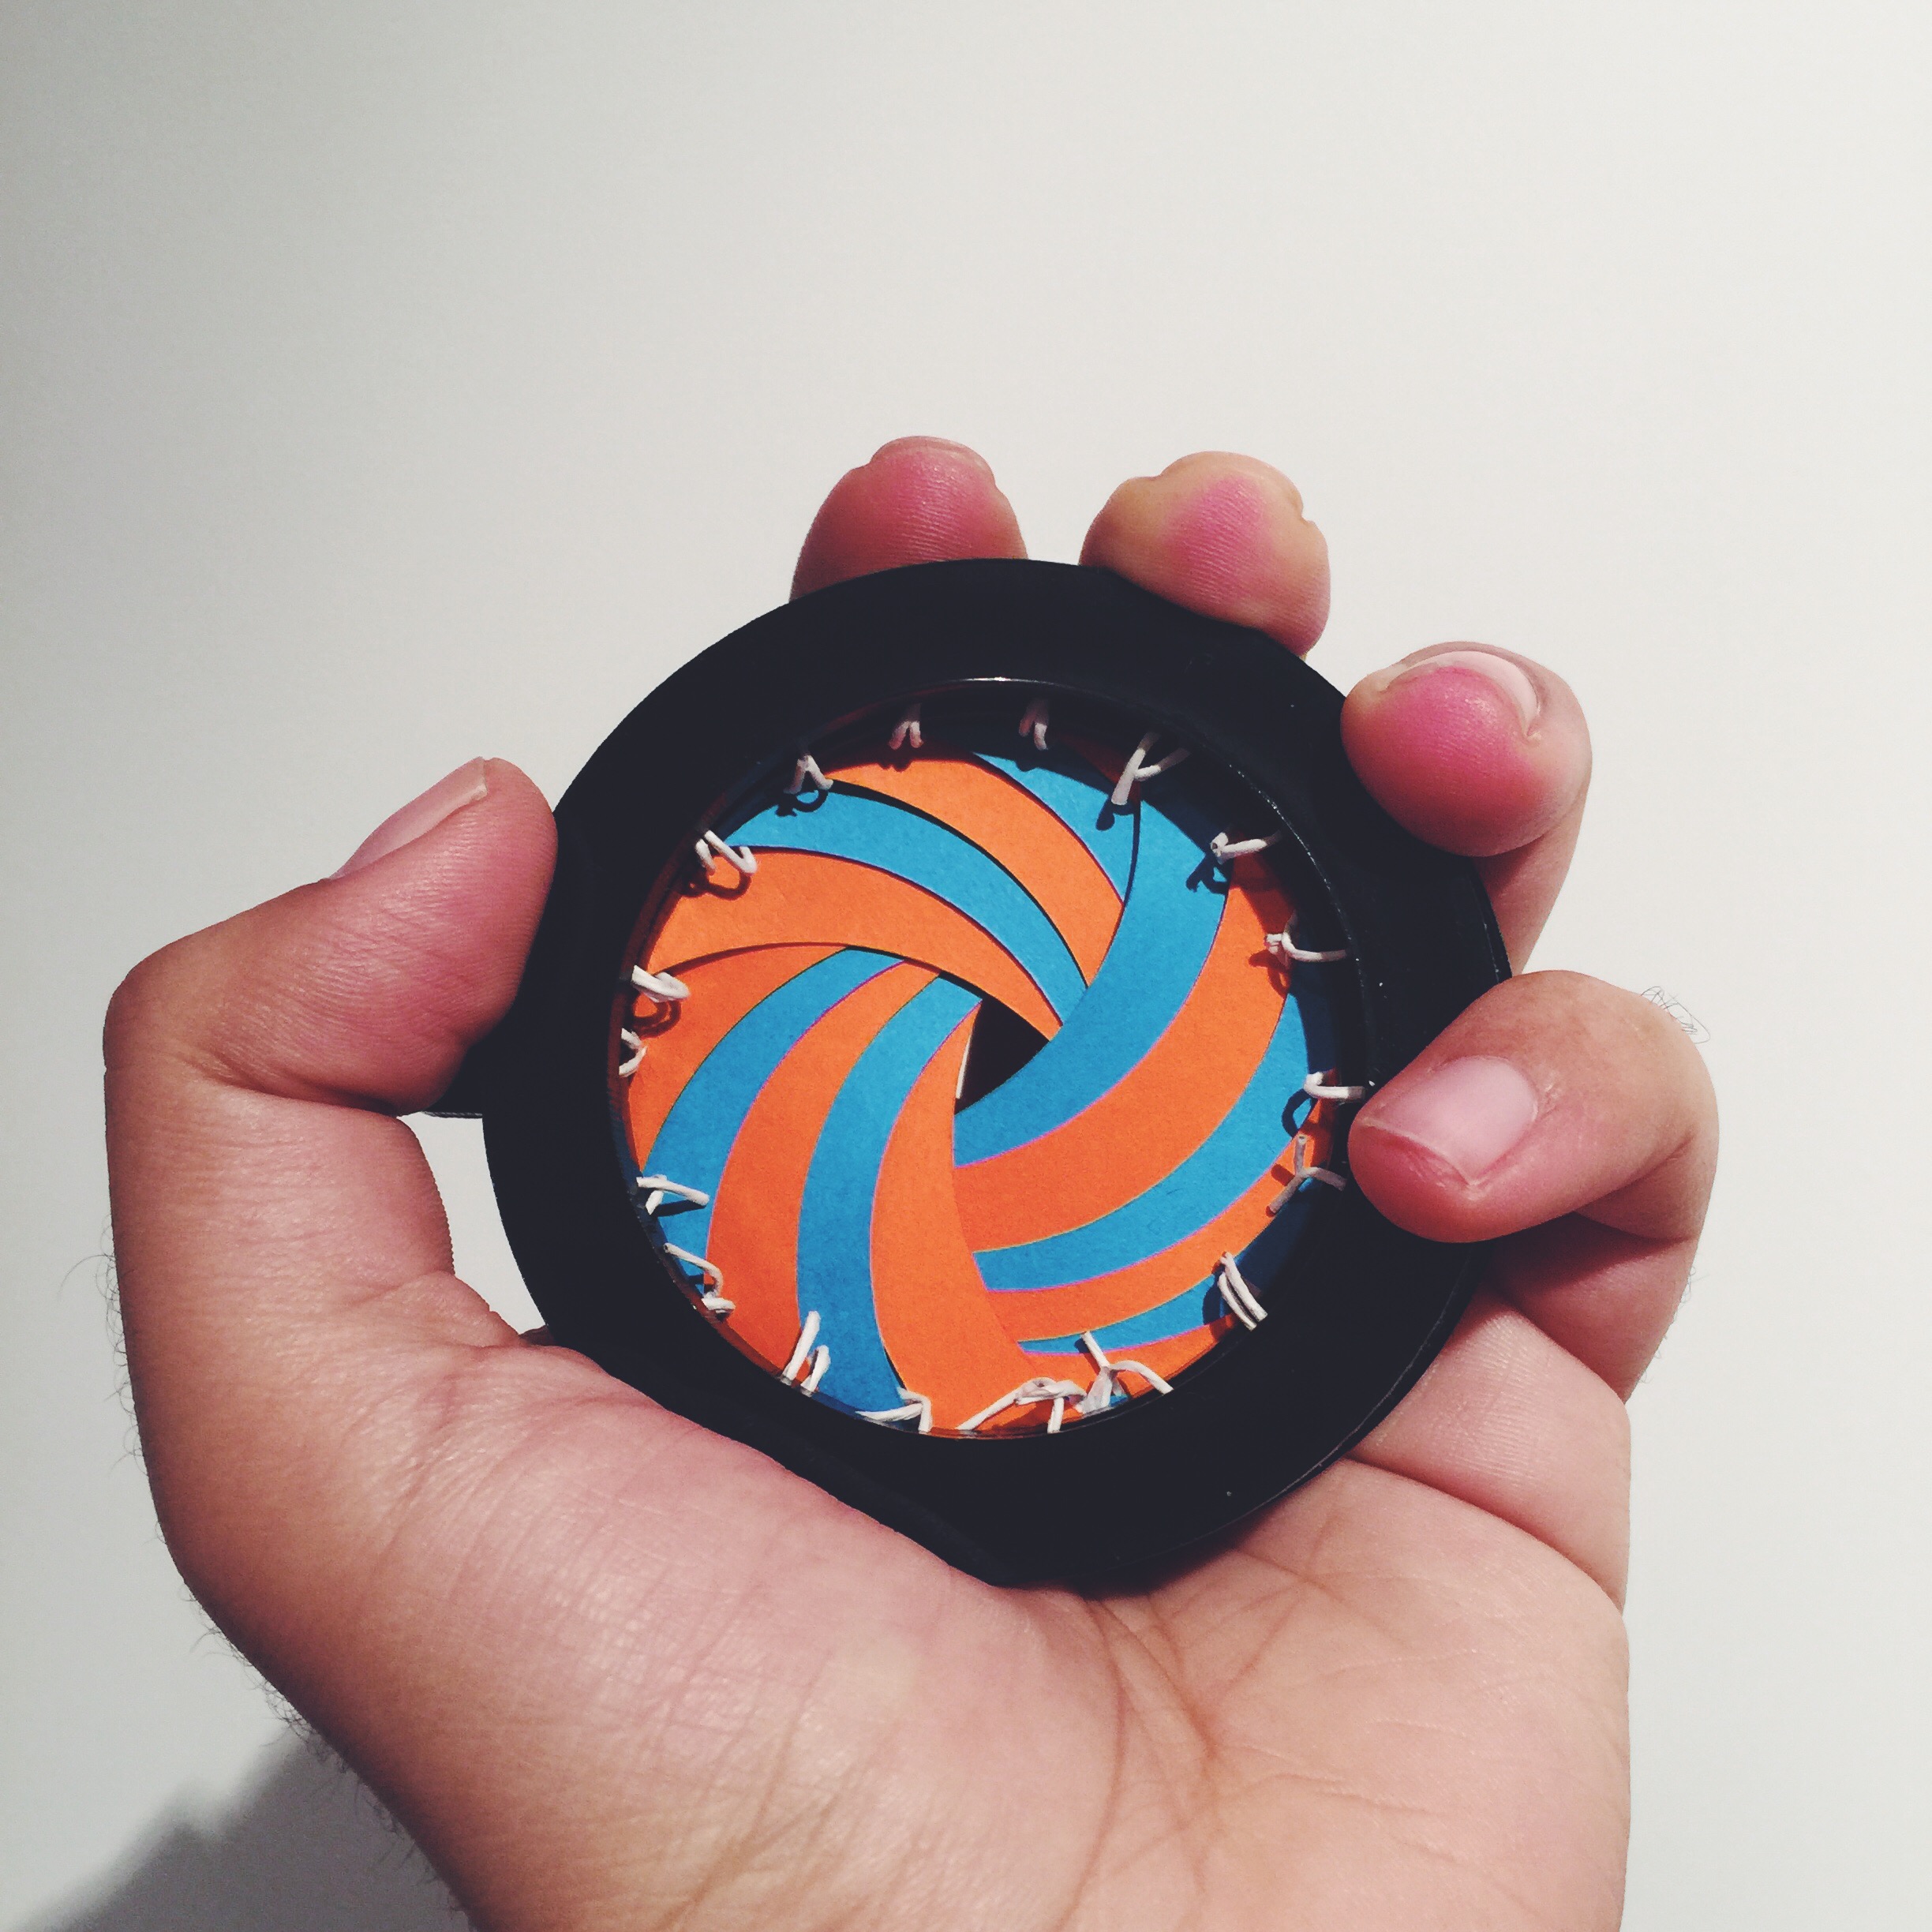
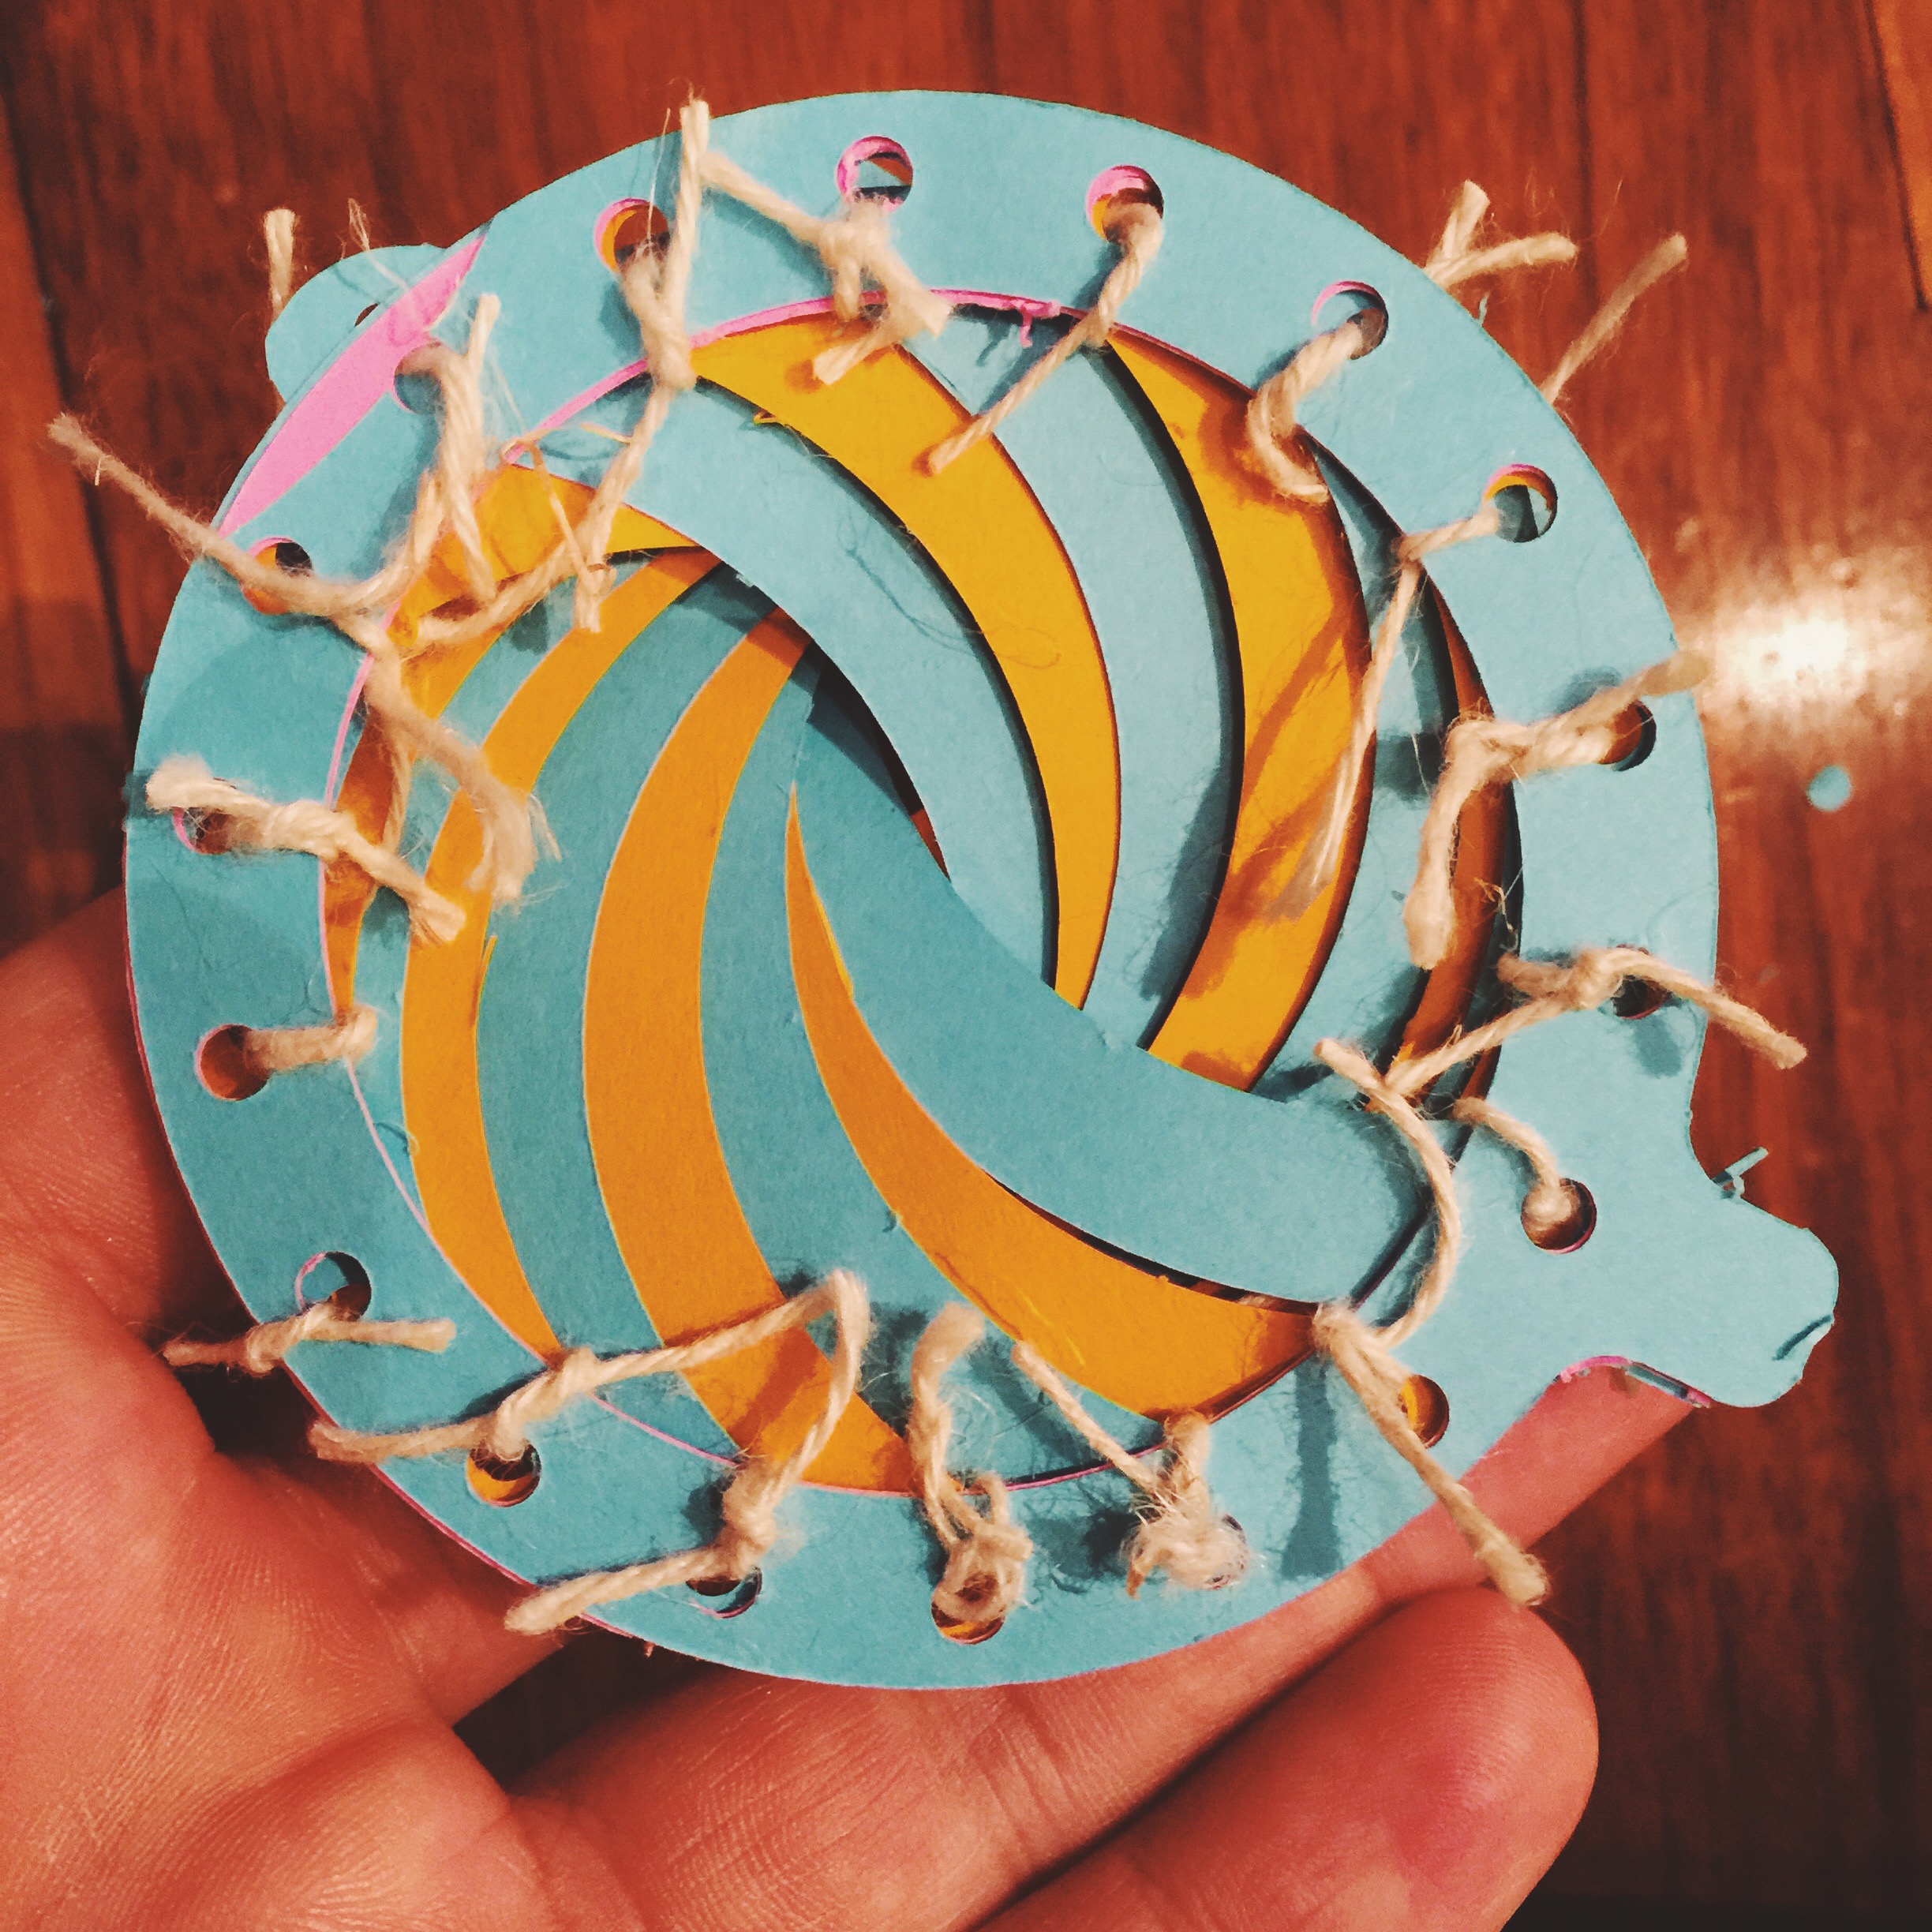
The final result, as is shown in the image at the top of this post, is functionally quite the improvement over the previous prototype. However, it has its share of problems: the choice of cardstock for the wedges is not strong enough to withstand the force applied by the friction frame. While it worked well initially (the wedges moved appropriately according to the direction of the motion), it soon lost its resistance and the pieces came undone.
Also, there is the visual problem of the visible wire fasteners. The appropriate substitute would be a non-wire like material, that I am yet to identify.
![Online Wayfinding System [Version 1.0]](http://www.rbknrbkn.com/workandprogress/wp-content/uploads/2014/12/0.jpeg)
(This post is a place for my concluding remarks for the online wayfinding system project that I started this semester. It is also the starting point for my work on it in the next semester.)
In this project, I ventured to explore, design, and implement the concept of an online wayfinding system.
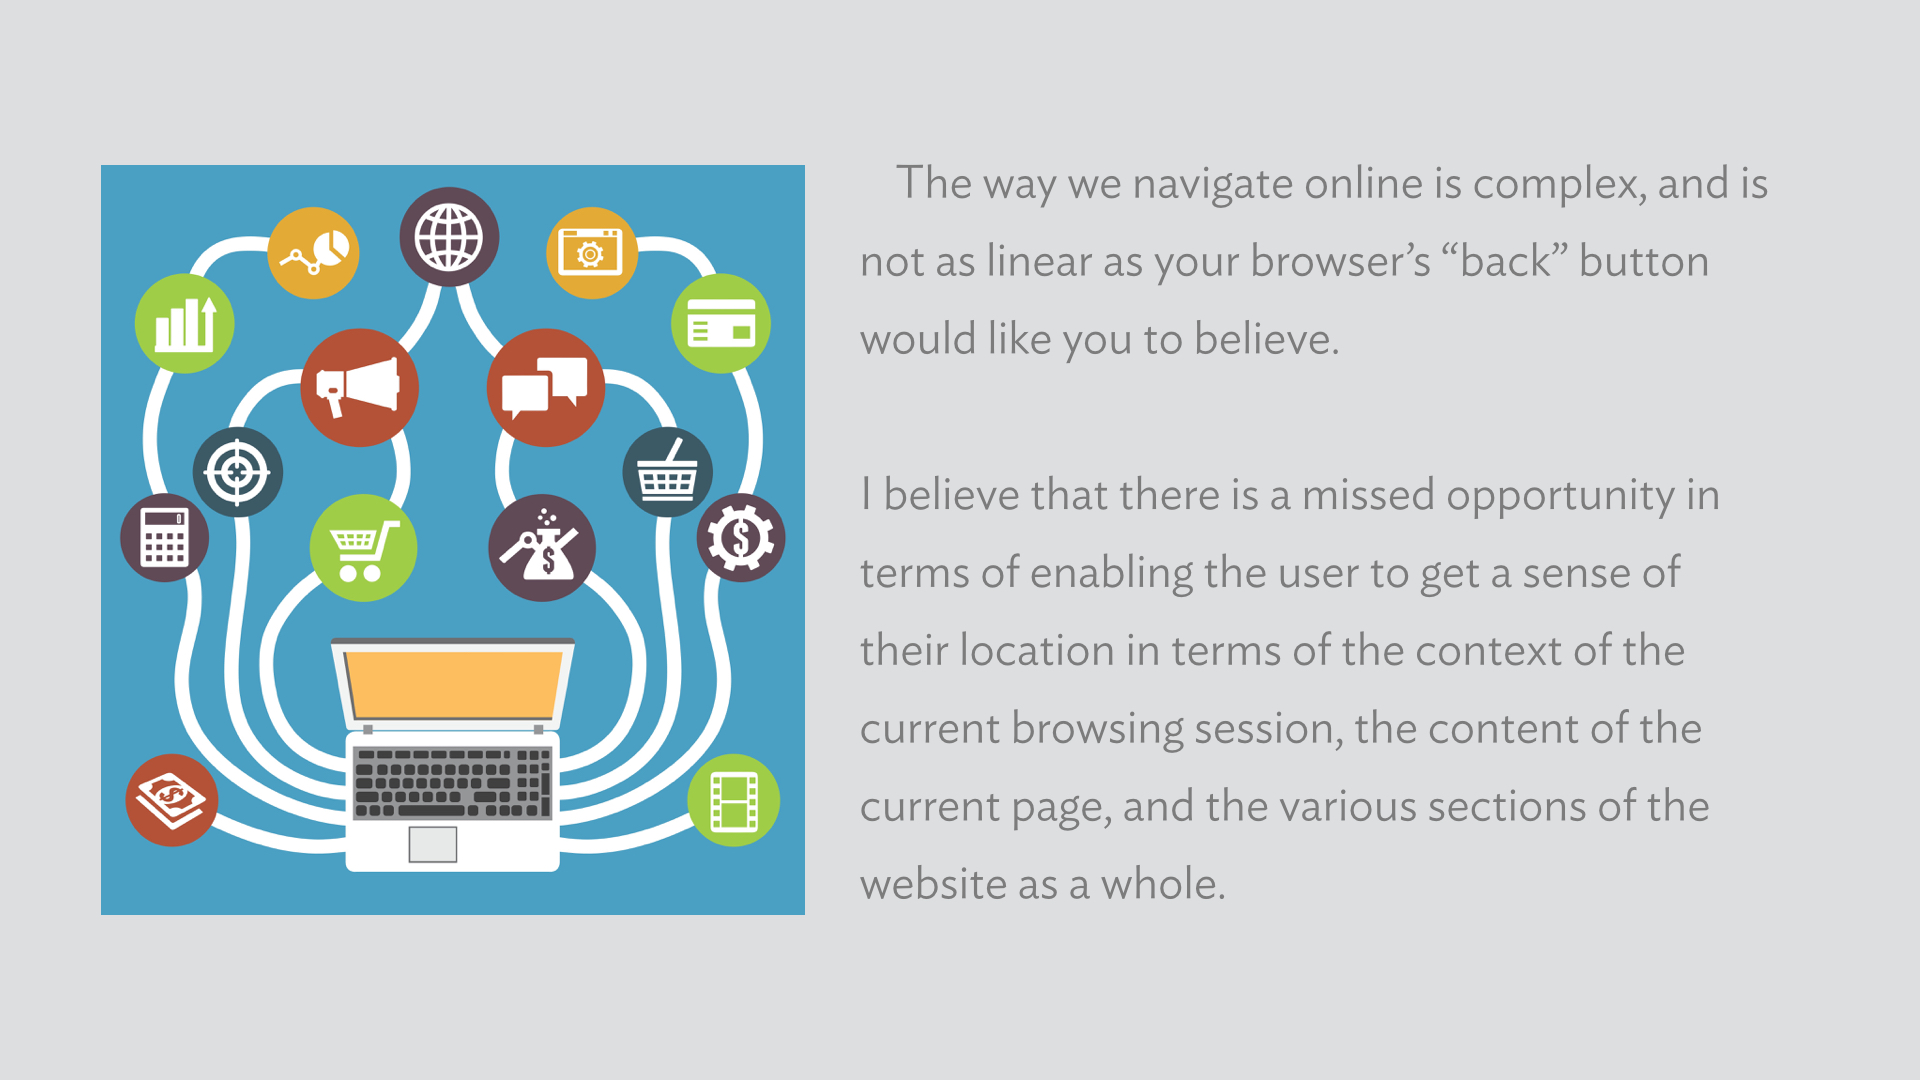
I started the process by trying to understand the problem further, including circulating a questionnaire about the tabs that the respondents had open in their browser window.

The problem, I found out, has three main challenging facets.
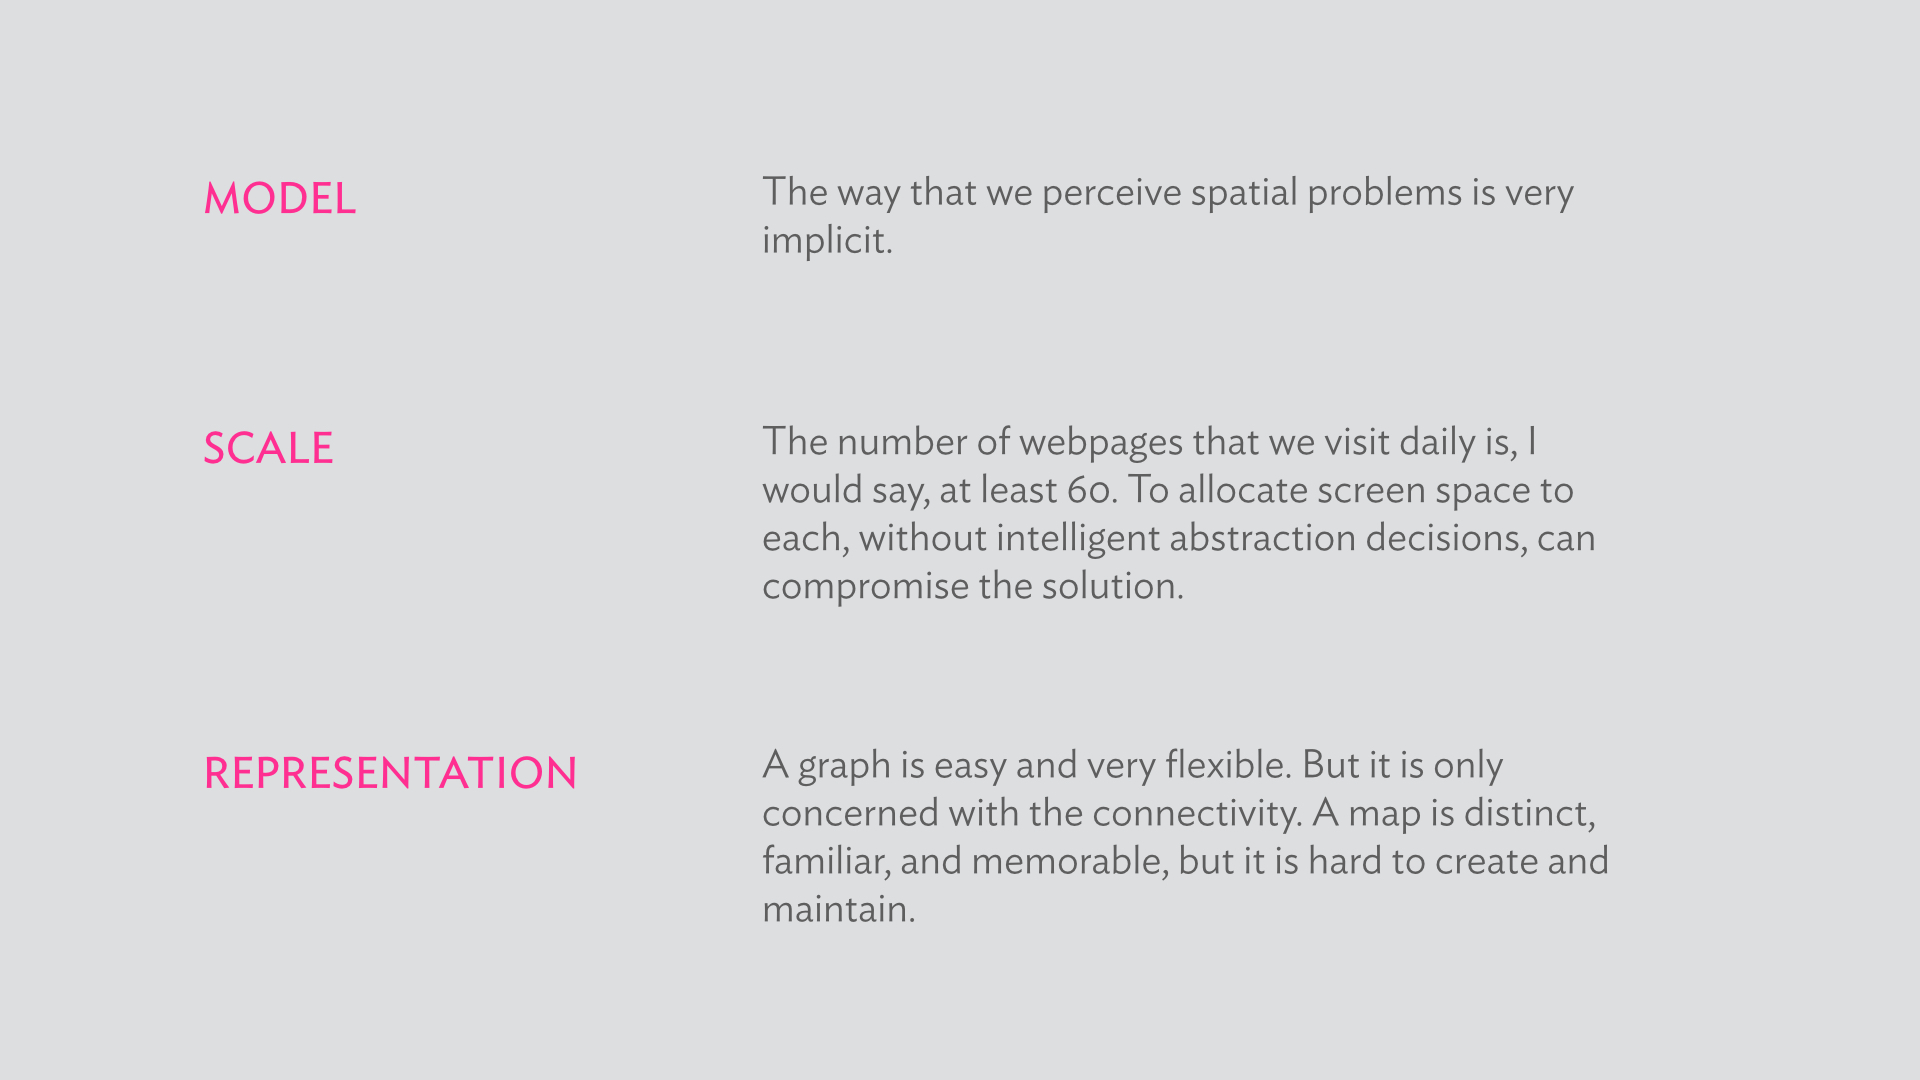
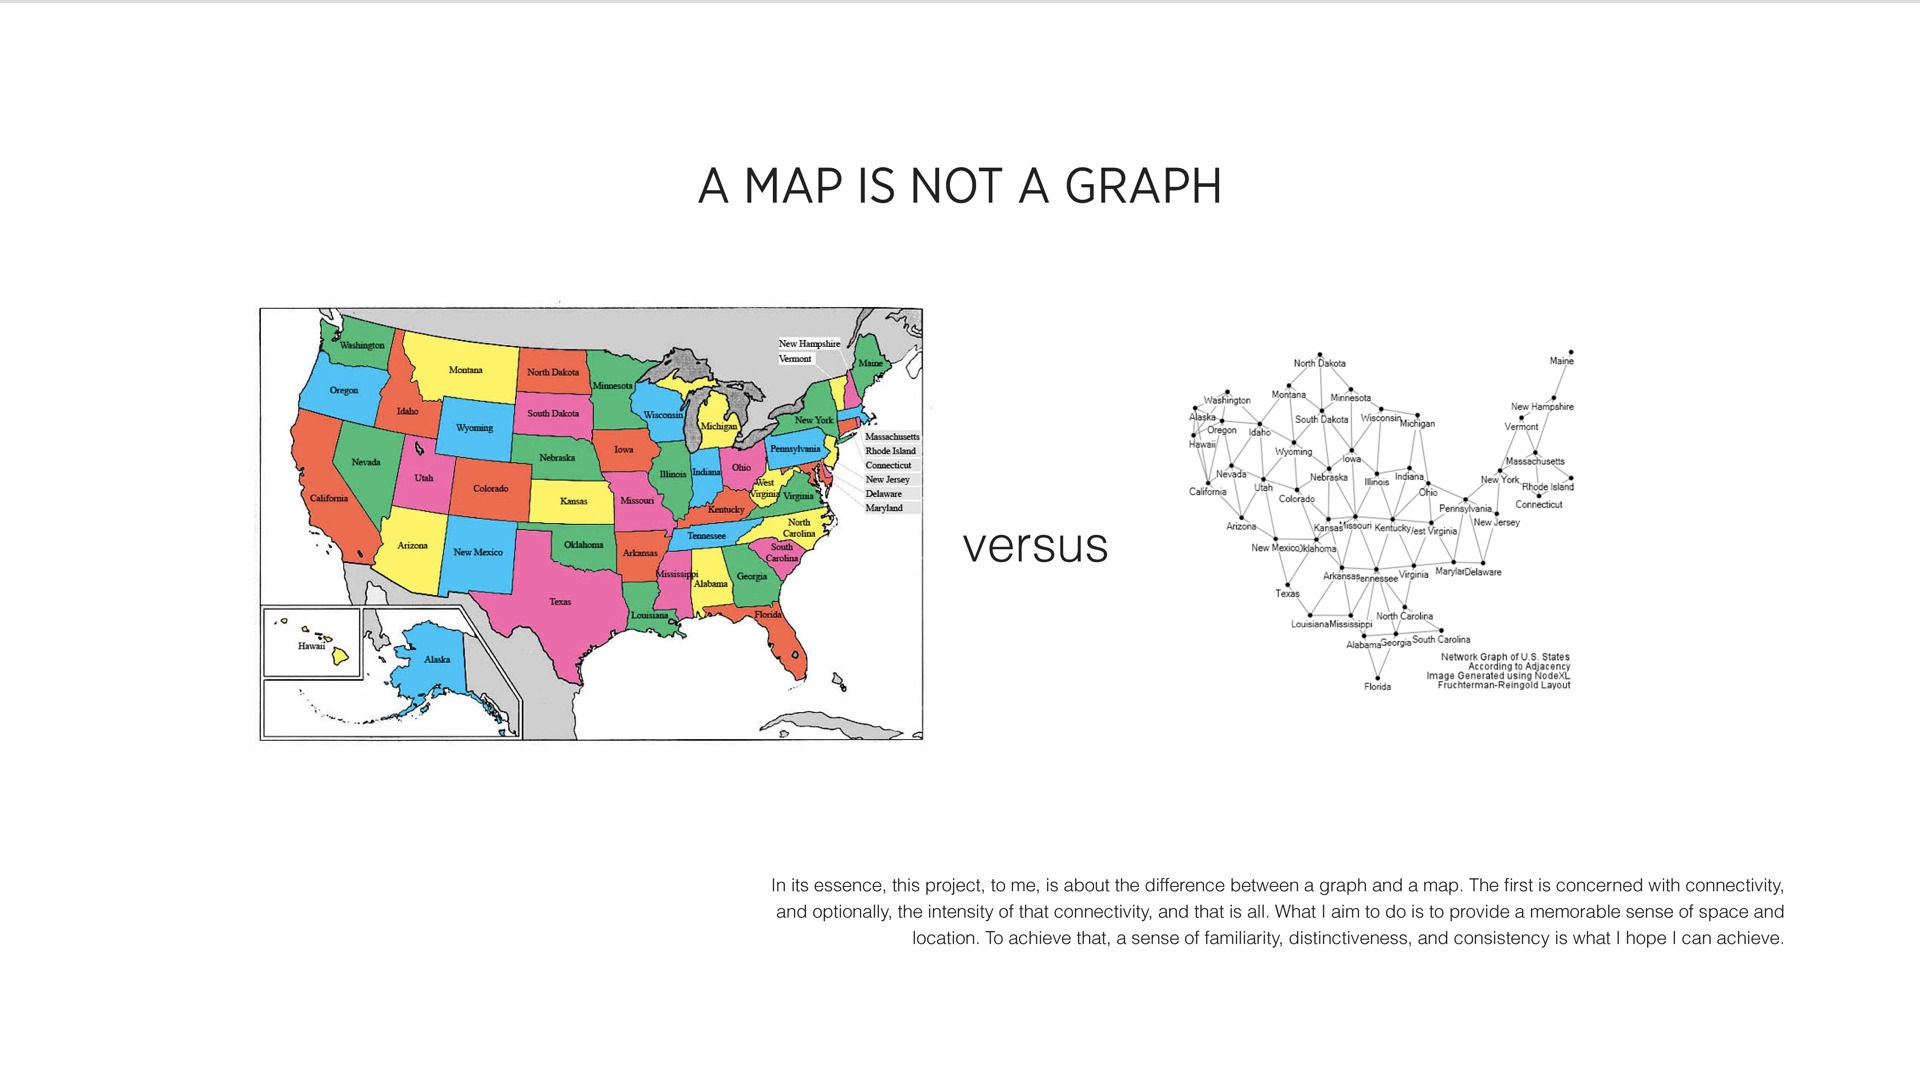
In particular, the representational aspect of the problem can be distilled by considering maps and graphs as two views of the same underlying data constructs. Each view has its own benefits, as shown below. Which of them is best for the problem at hand?
To explore the problem further, I followed a process that is abbreviated below throughout this semester.
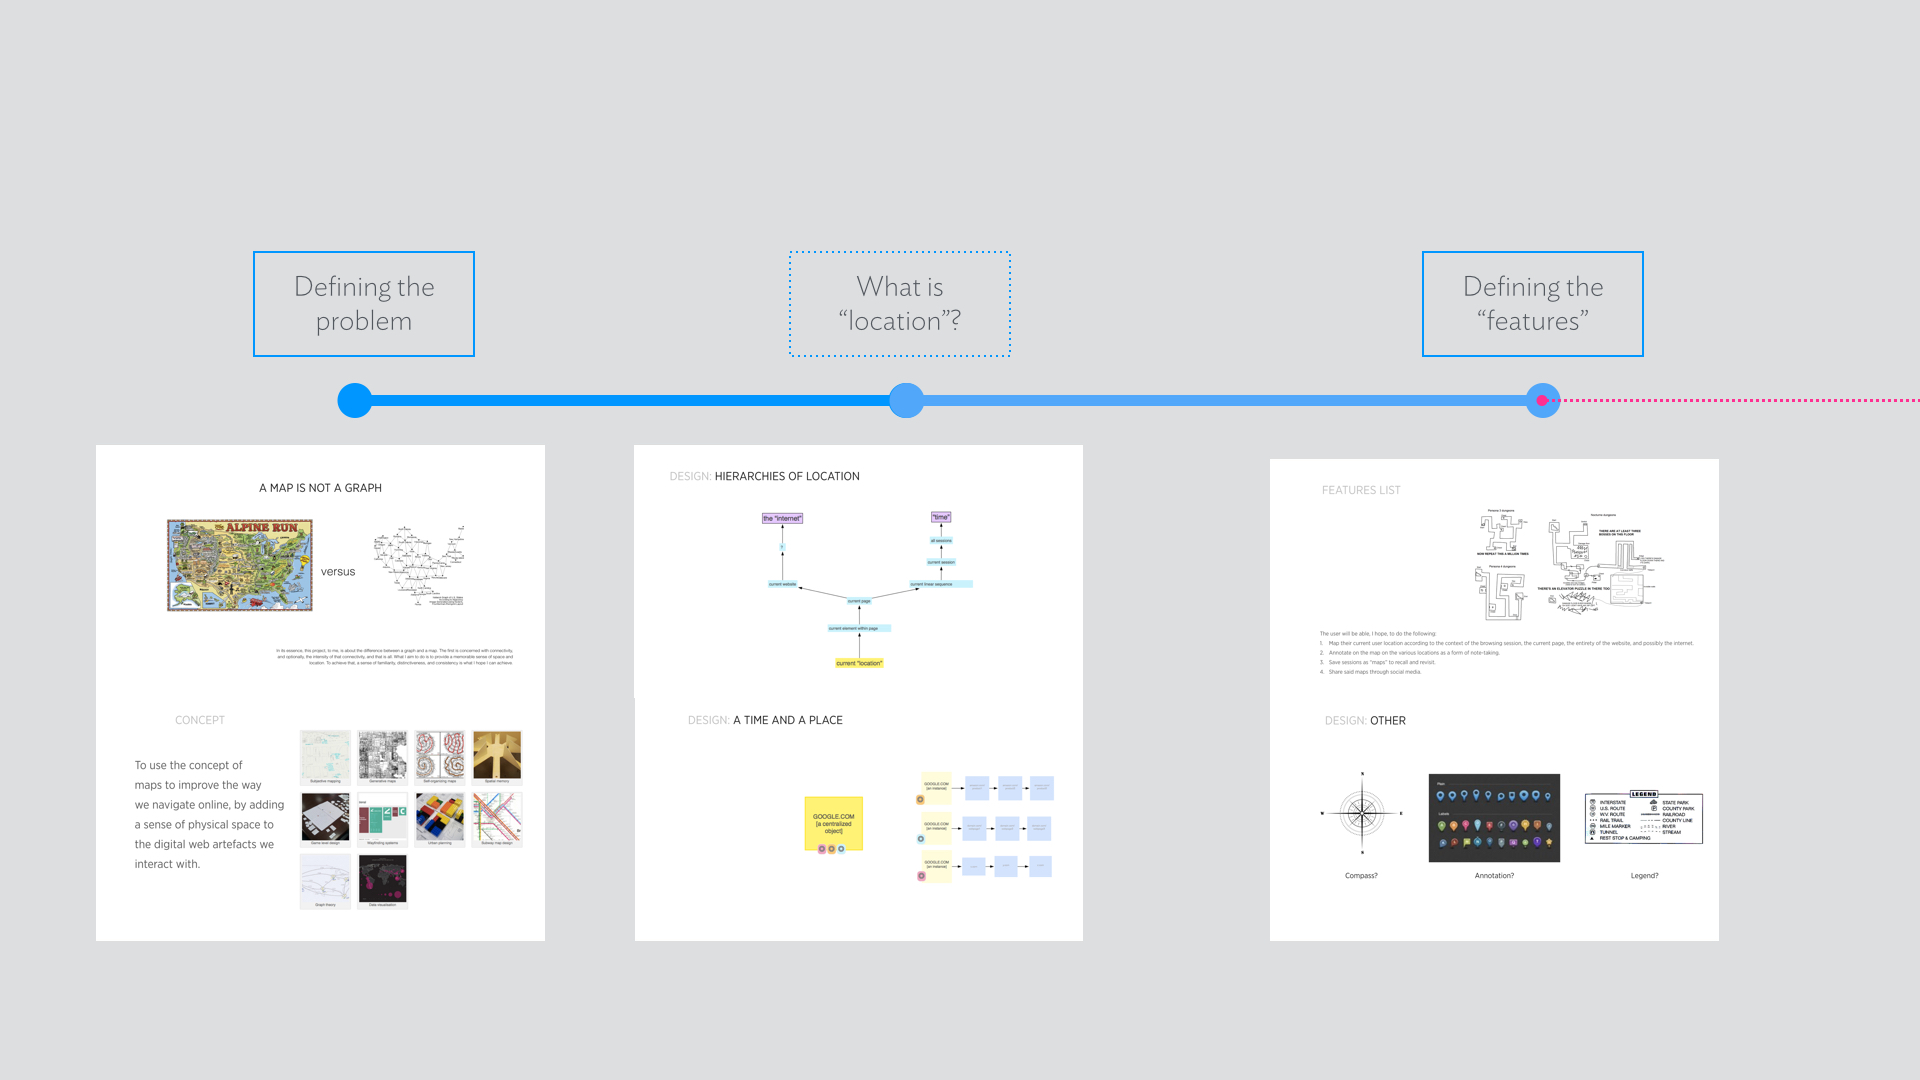
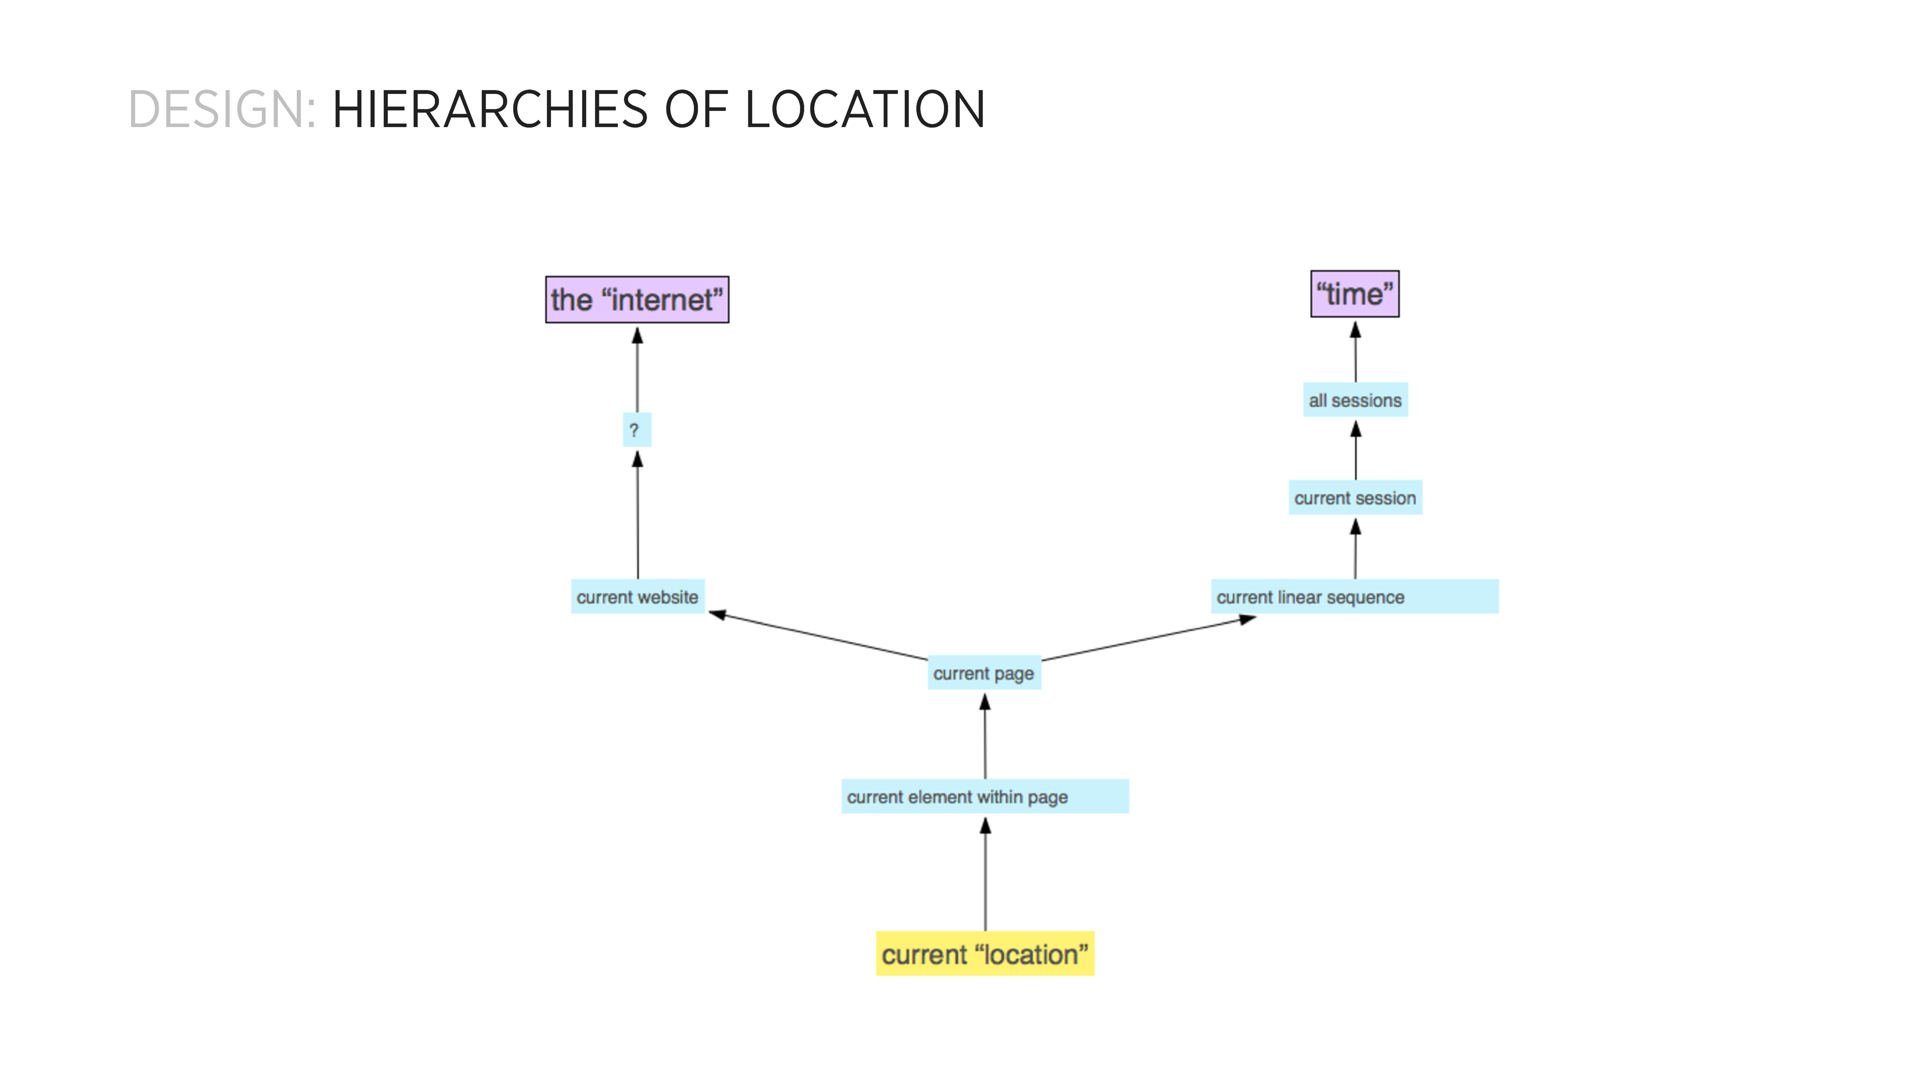
Additionally, I found out that it is important to understand what a location is when we speak about an online session. There is the obvious, topographical definition of the term, where a web page is part of a domain hosted in a server. More pragmatic, however, is the view of a location as a point of time in a browsing session, as a particular page-visit.
From there, I started the process of designing the dynamic “map” I wanted to implement.
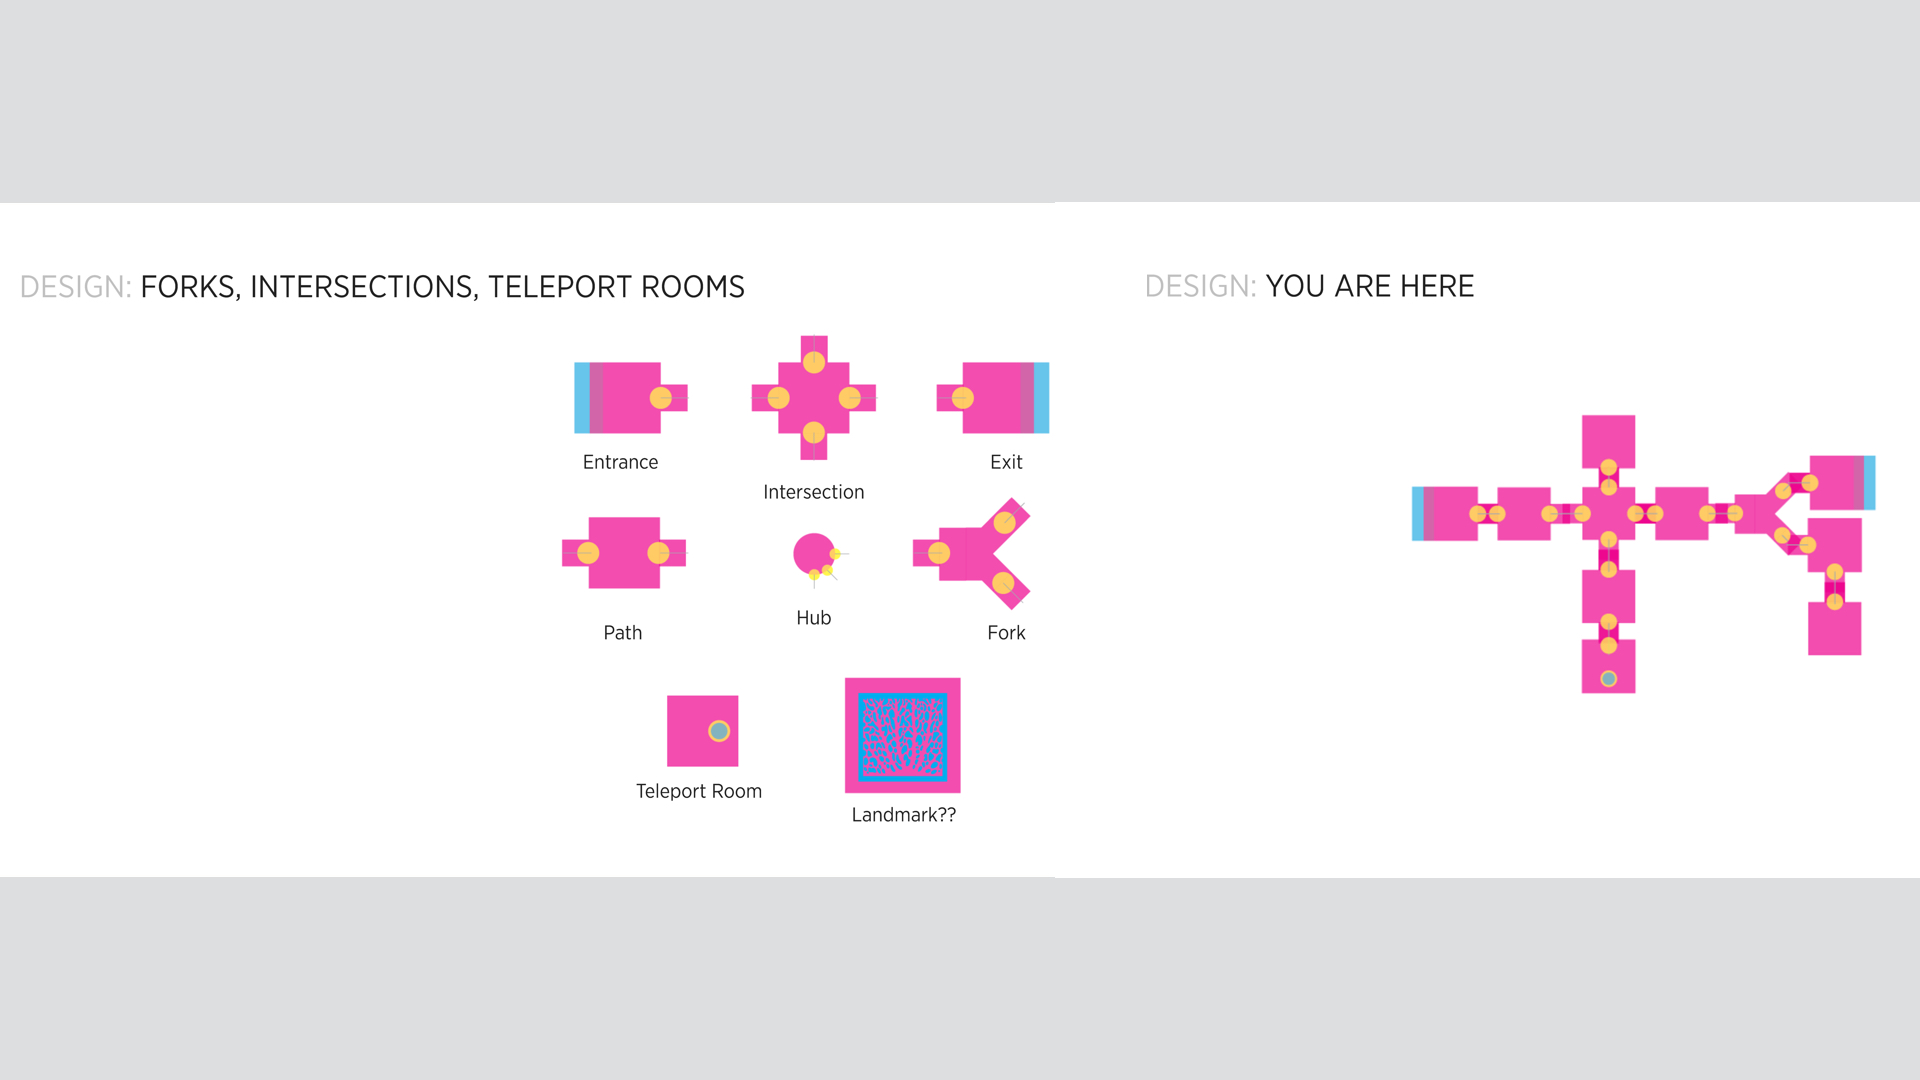
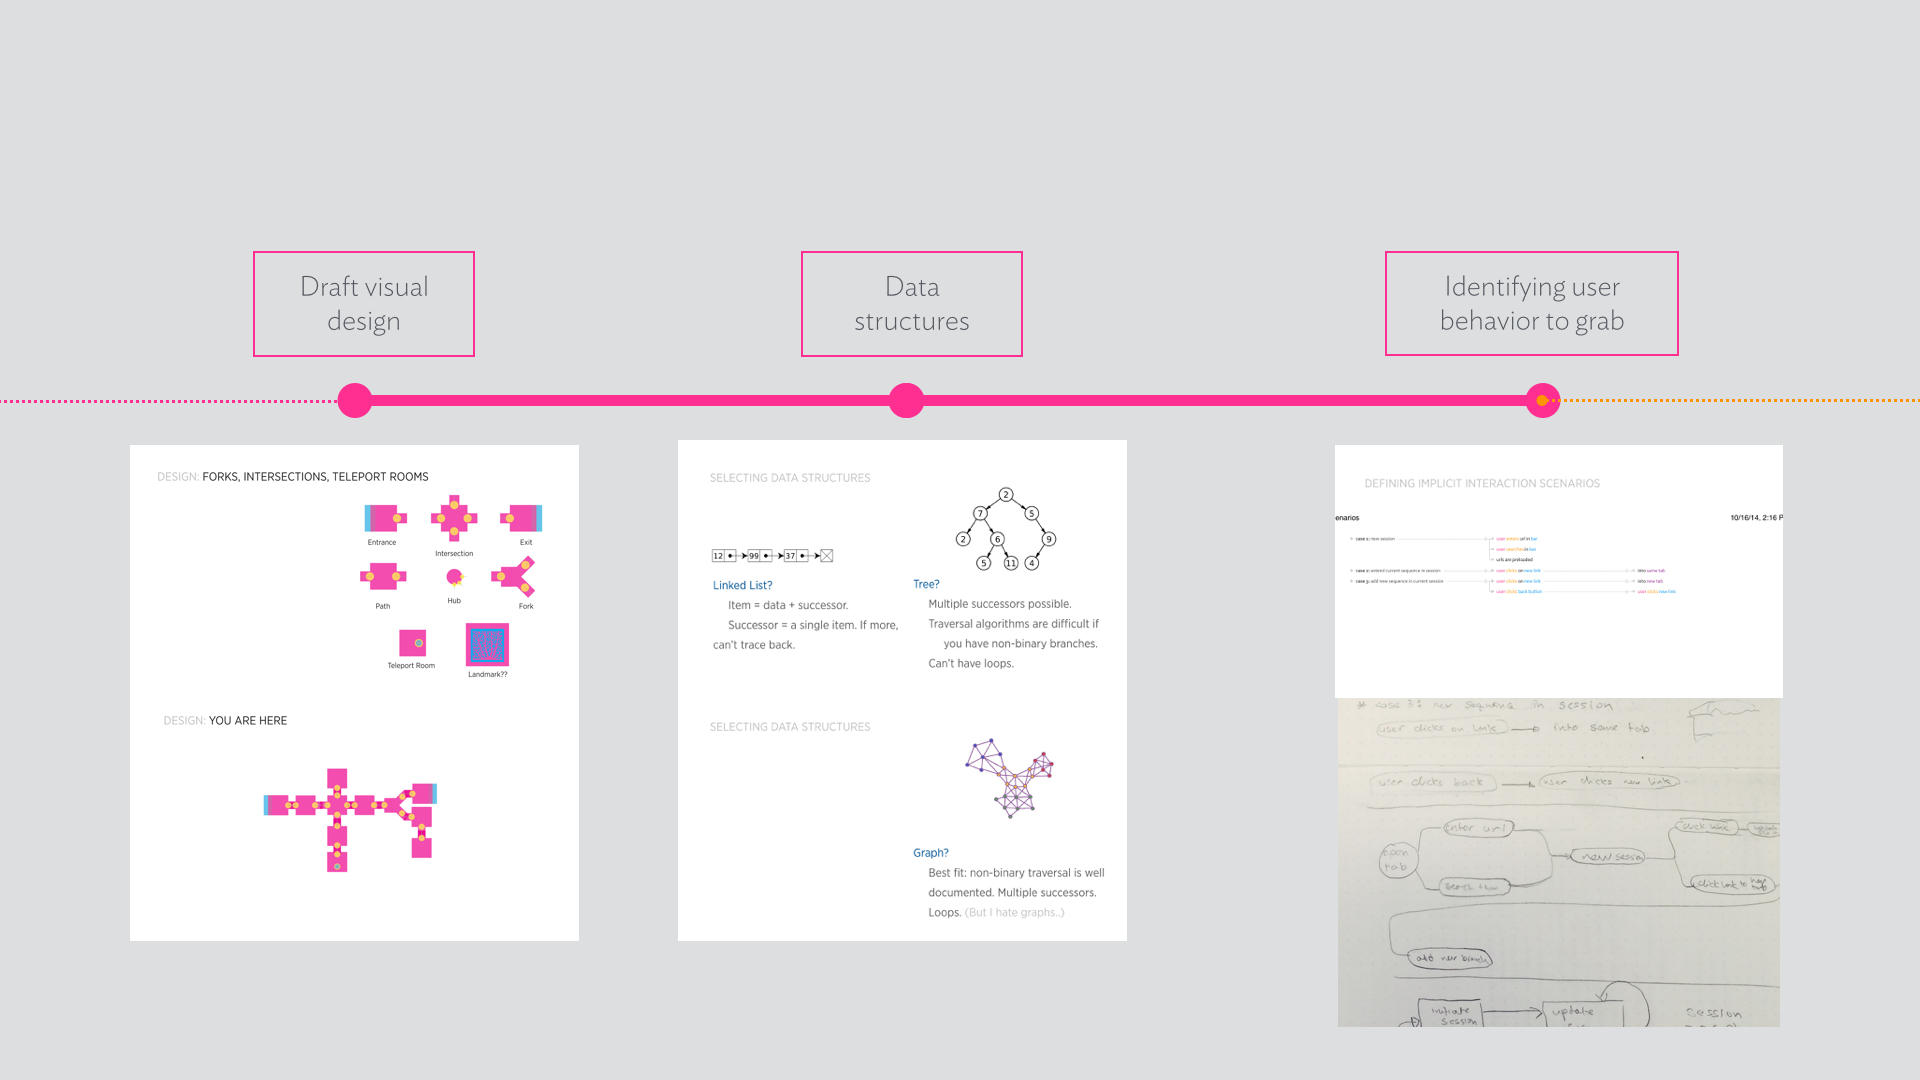
I worked on defining a modular visual language that allows for showing each visit according to its connectivity to other visits.
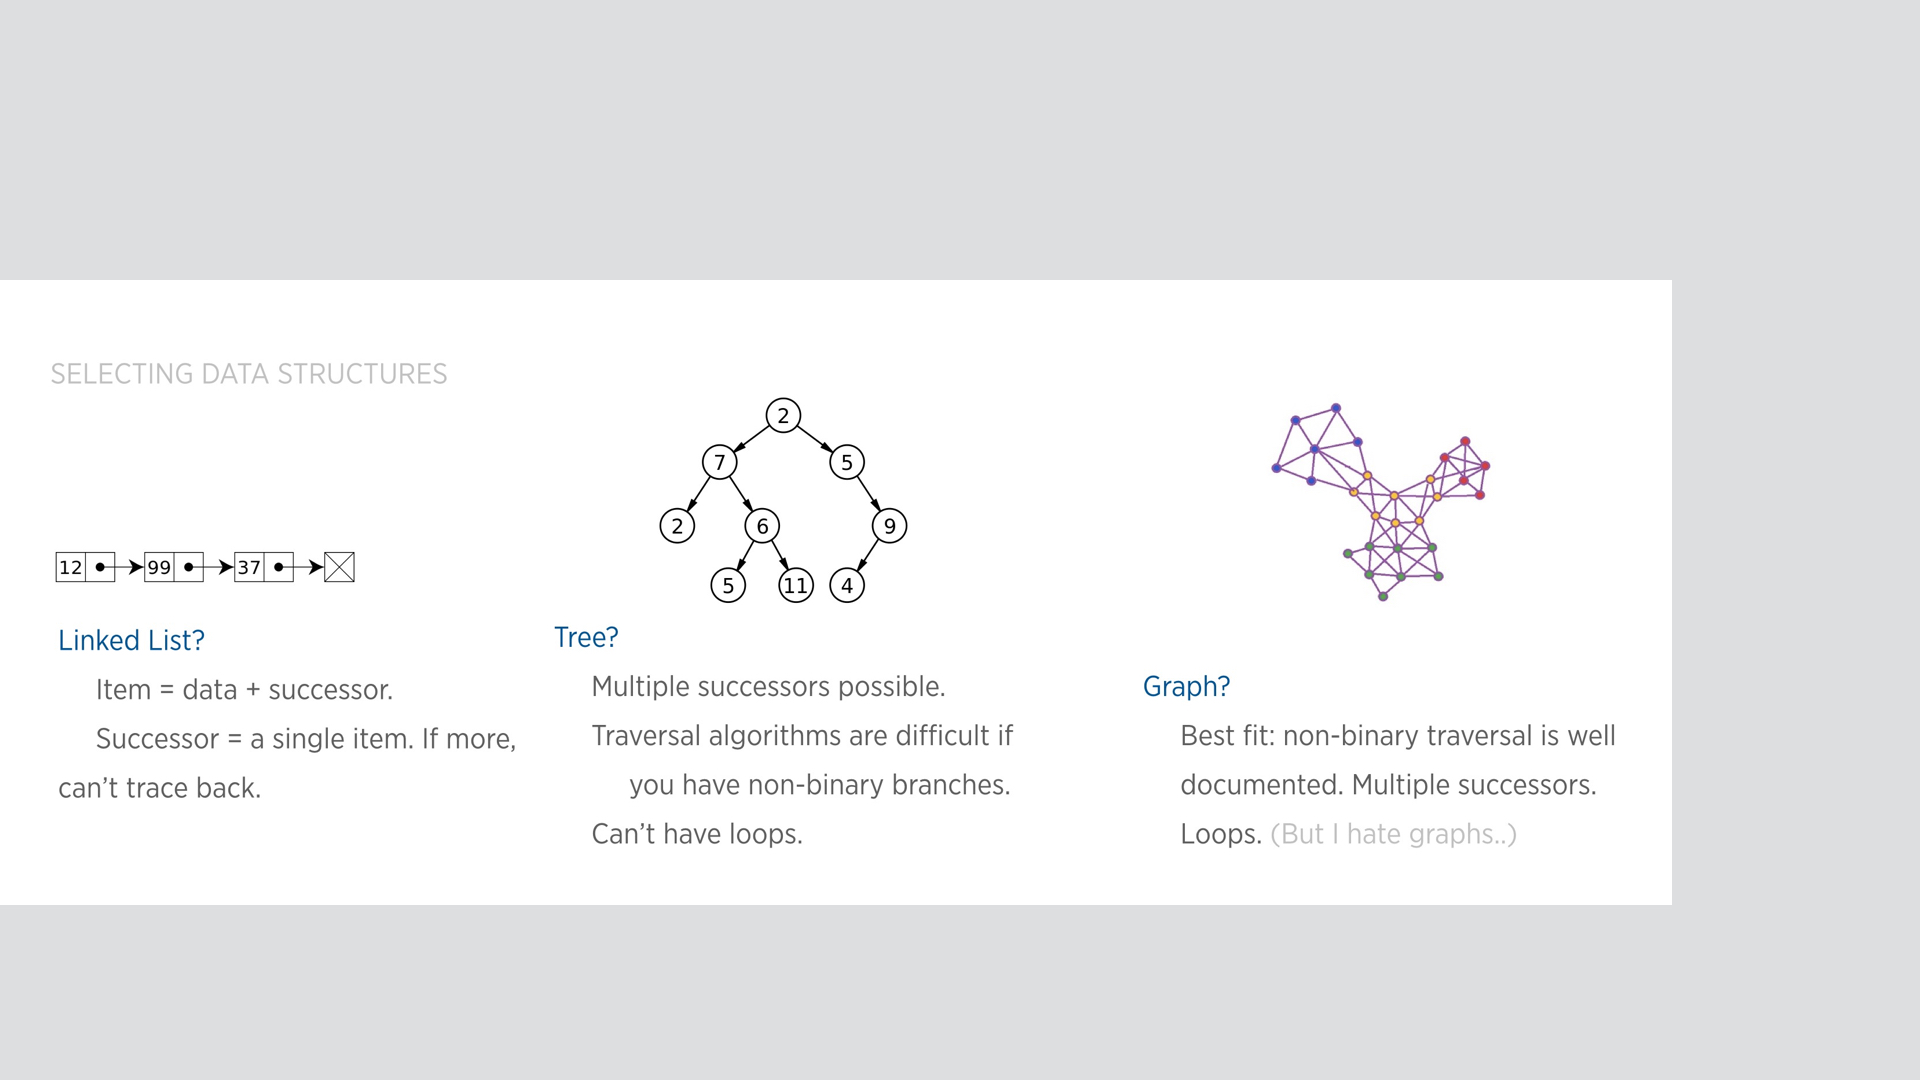
In terms of data structures, I experimented with a few. A graph, at least as a data structure, is the best fit for the job.
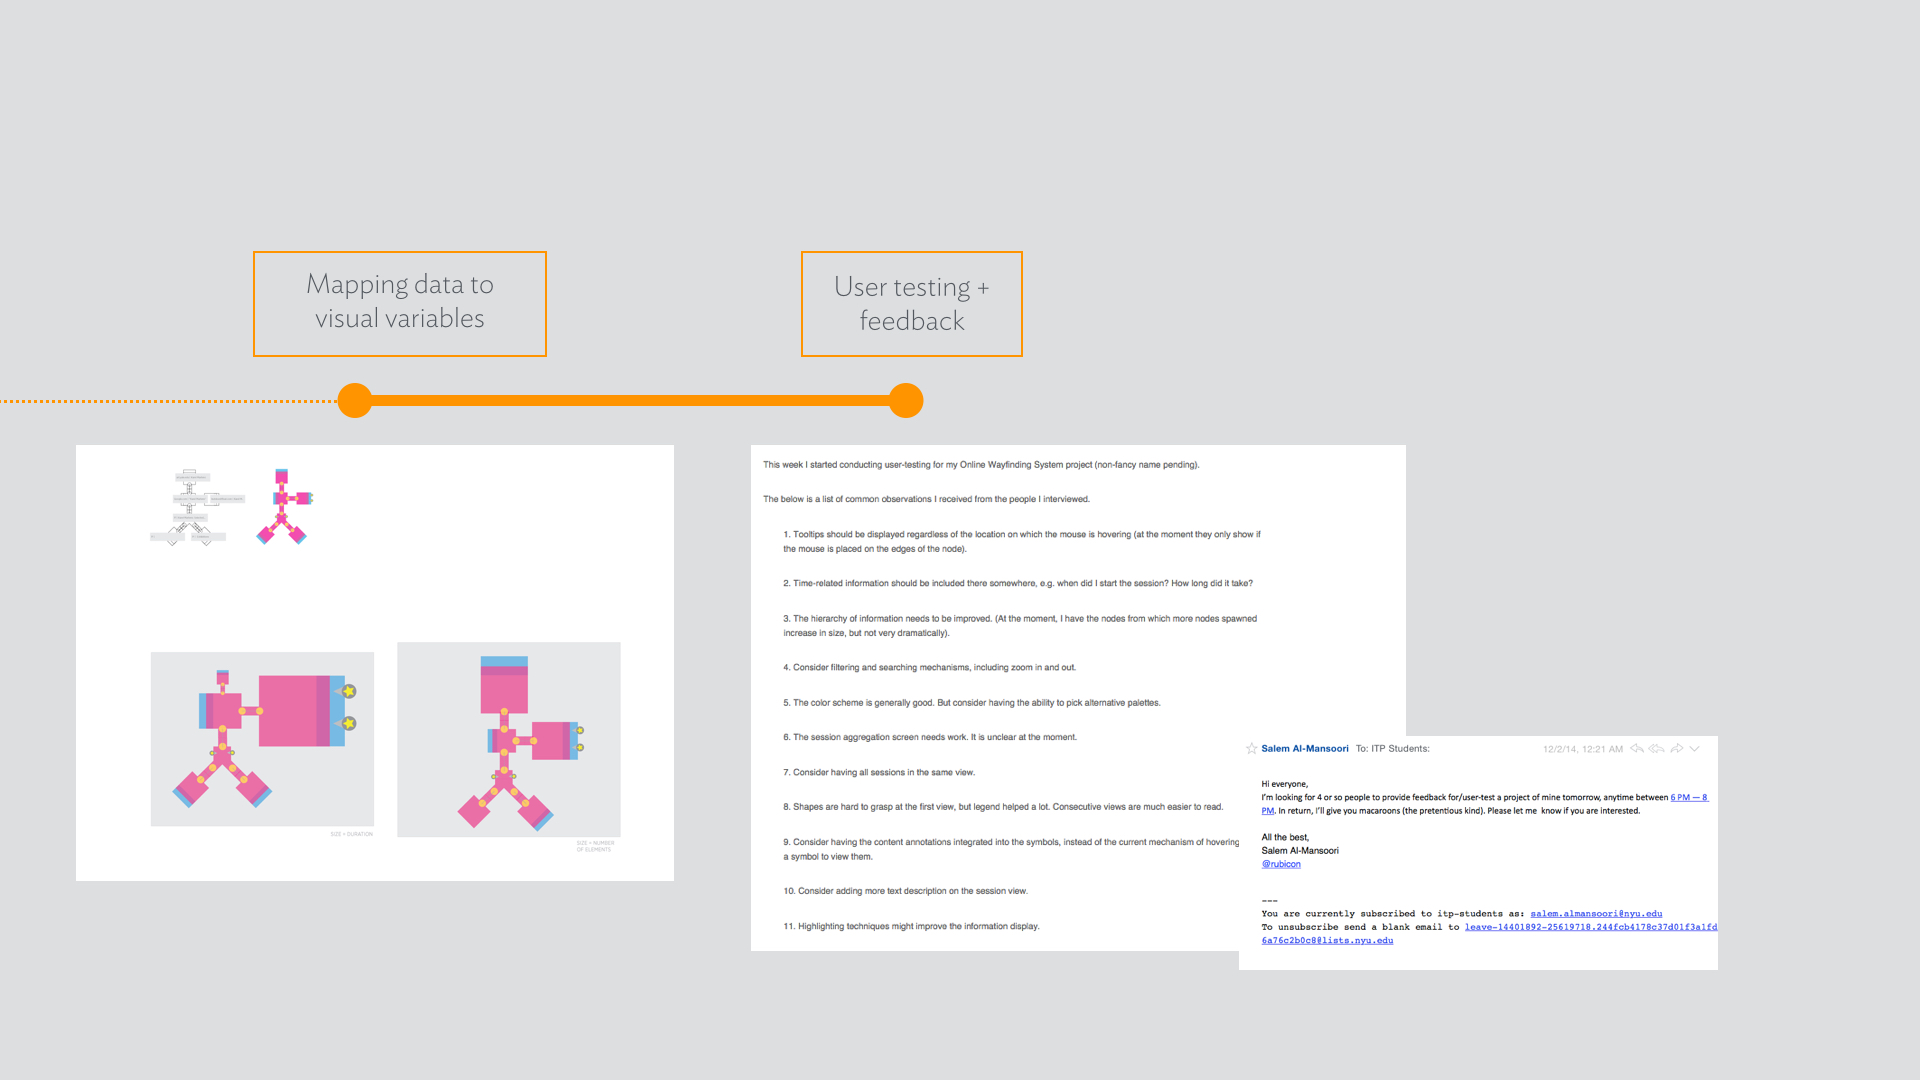
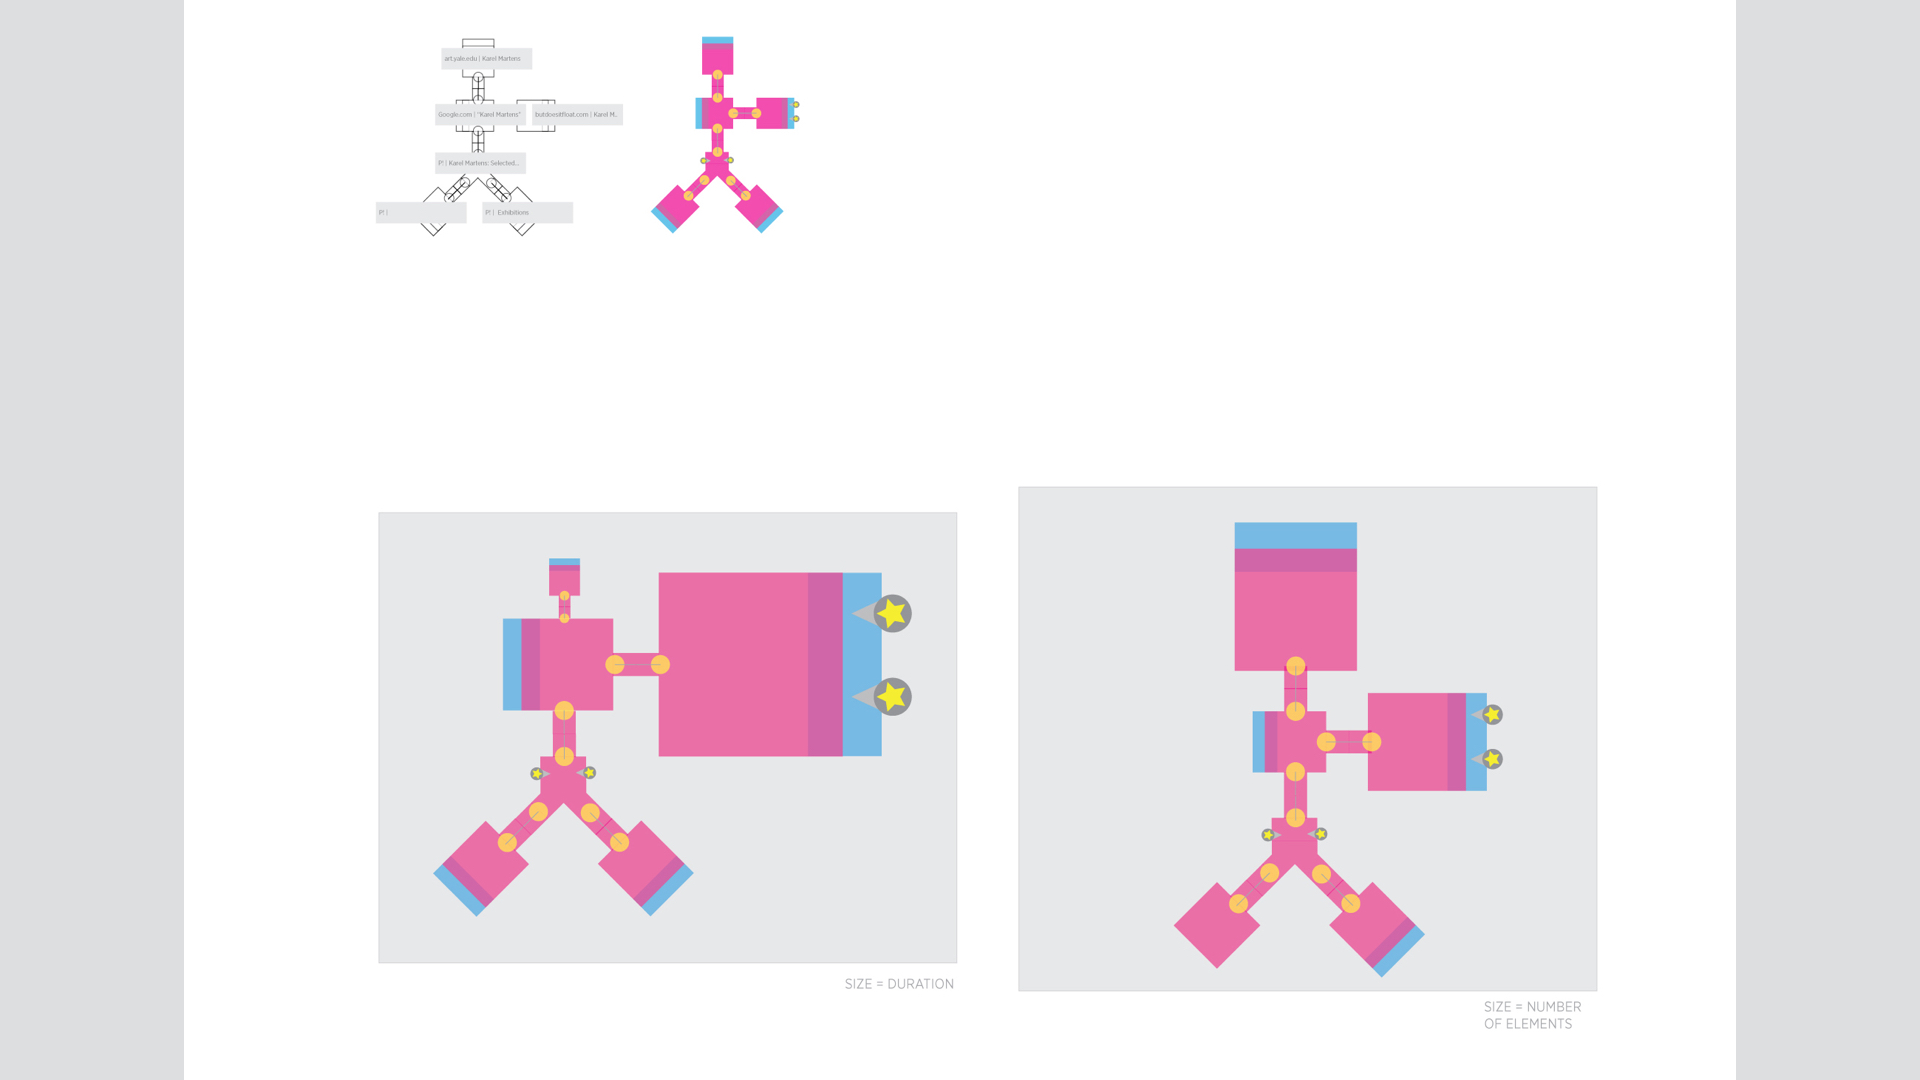
Next was mapping the parameters of visits to their visual representations. I experimented with a few combinations.
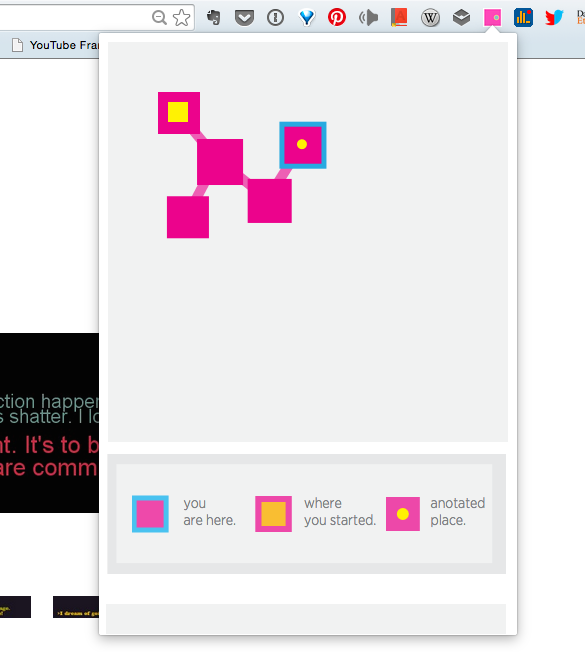
The final product, at least in its current iteration, is a Chrome extension I created using JavaScript, jsnetworkx, d3js, jQuery, among other framework.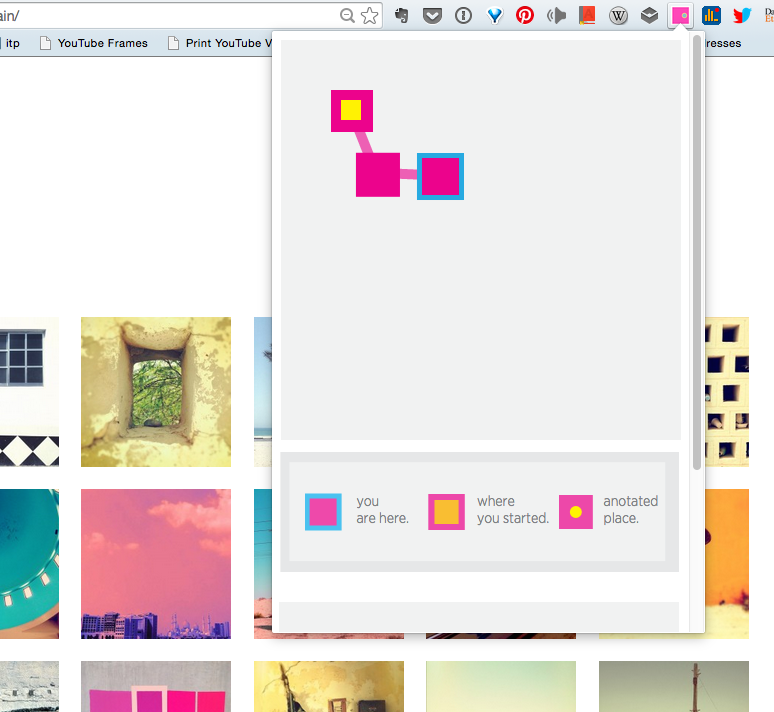
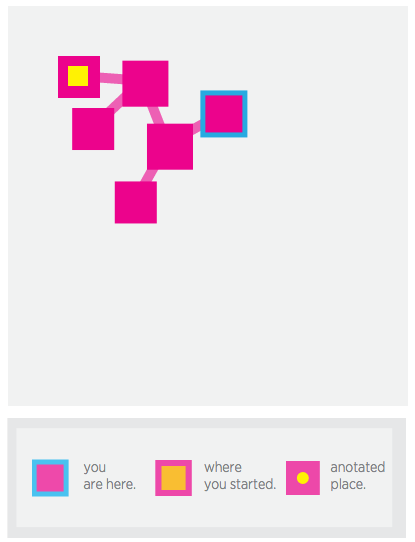
The main map view is supplemented with a legend. The extension listens passively to the user’s activities, and accordingly categorises each action into a location in the current session, or in a new one.
As you progress into a browsing session, forks and intersections are introduced to the map view. The size of each node is proportional to the number of paths it led to.
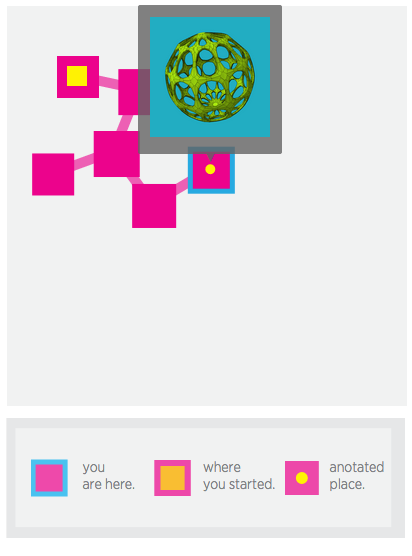
The user also has the ability to “annotate” each node by selecting an element from the page, whether an image or a text, to be added to the node as a form of note-taking and highlighting for future reference.
The below is a rough estimation of how I’ve spent my time in this project. How I wish it was is more of the pink stuff and less of blue ones.
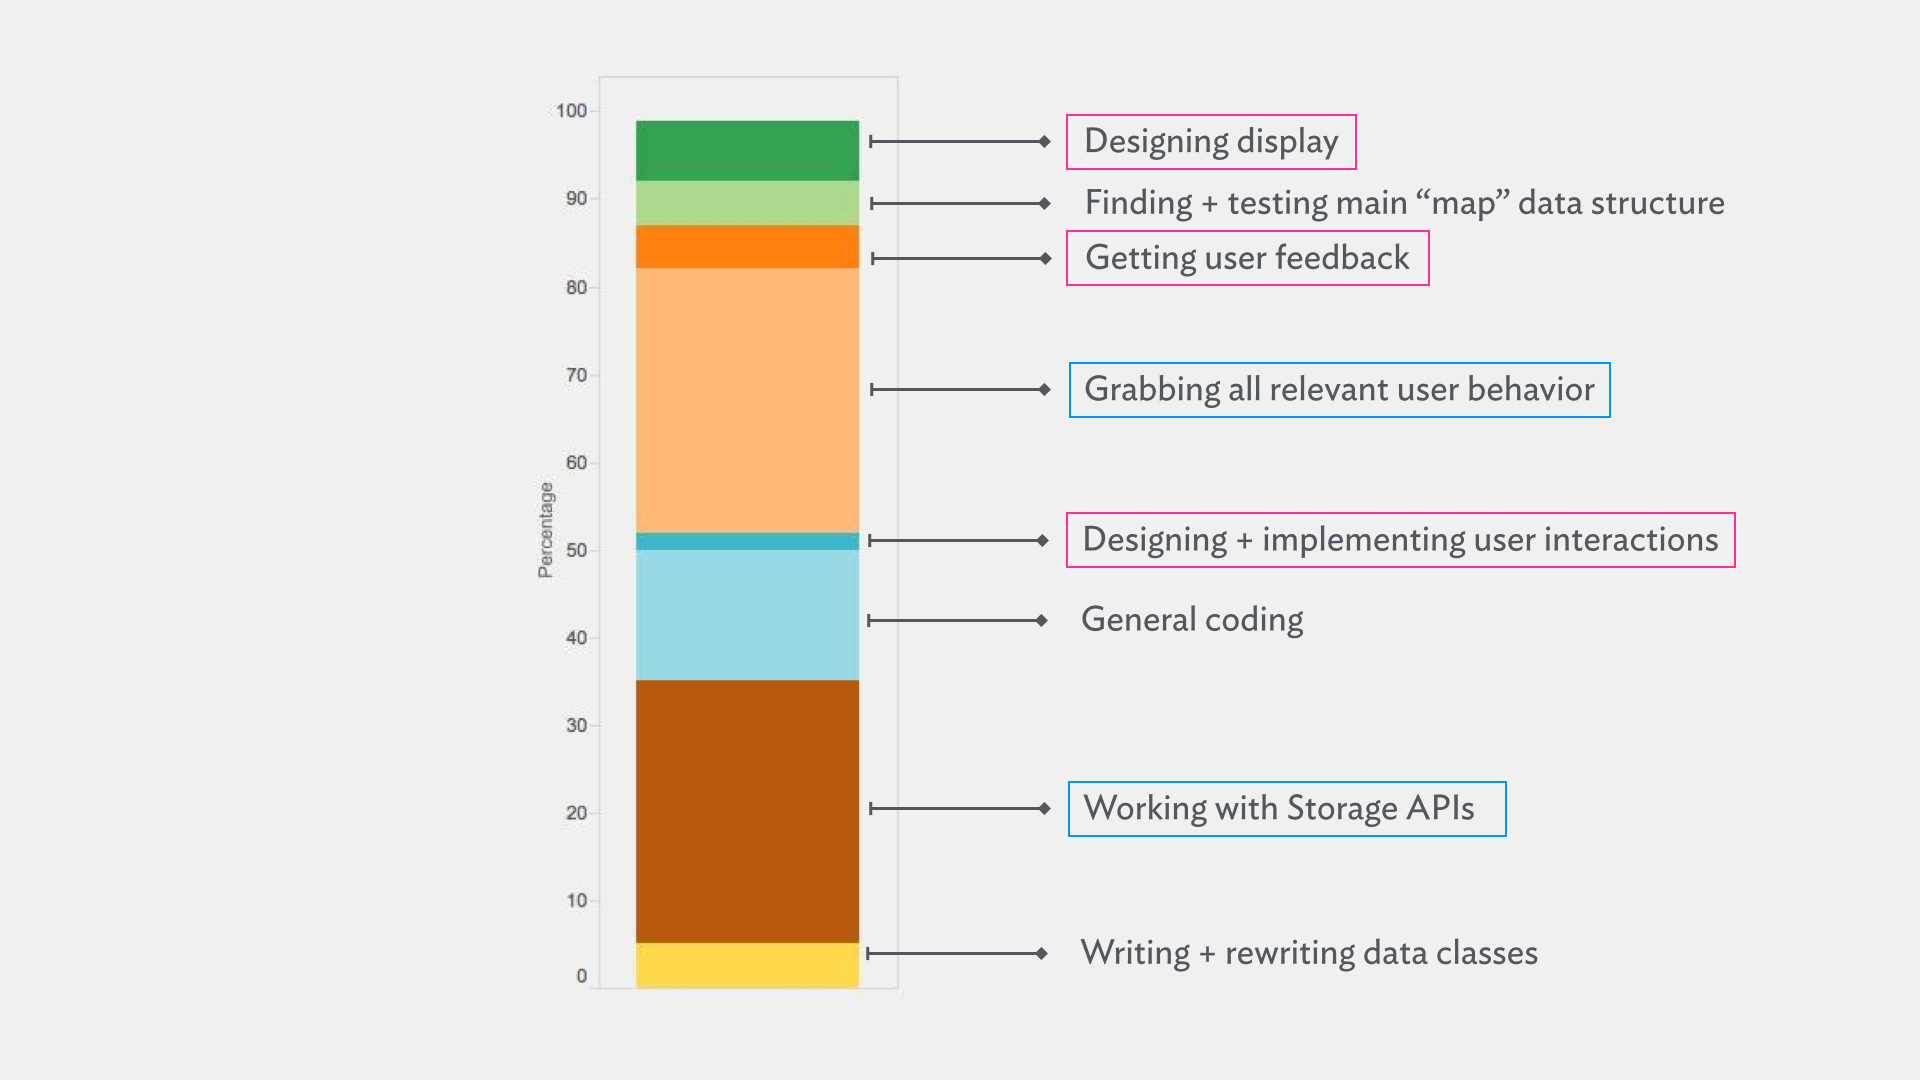
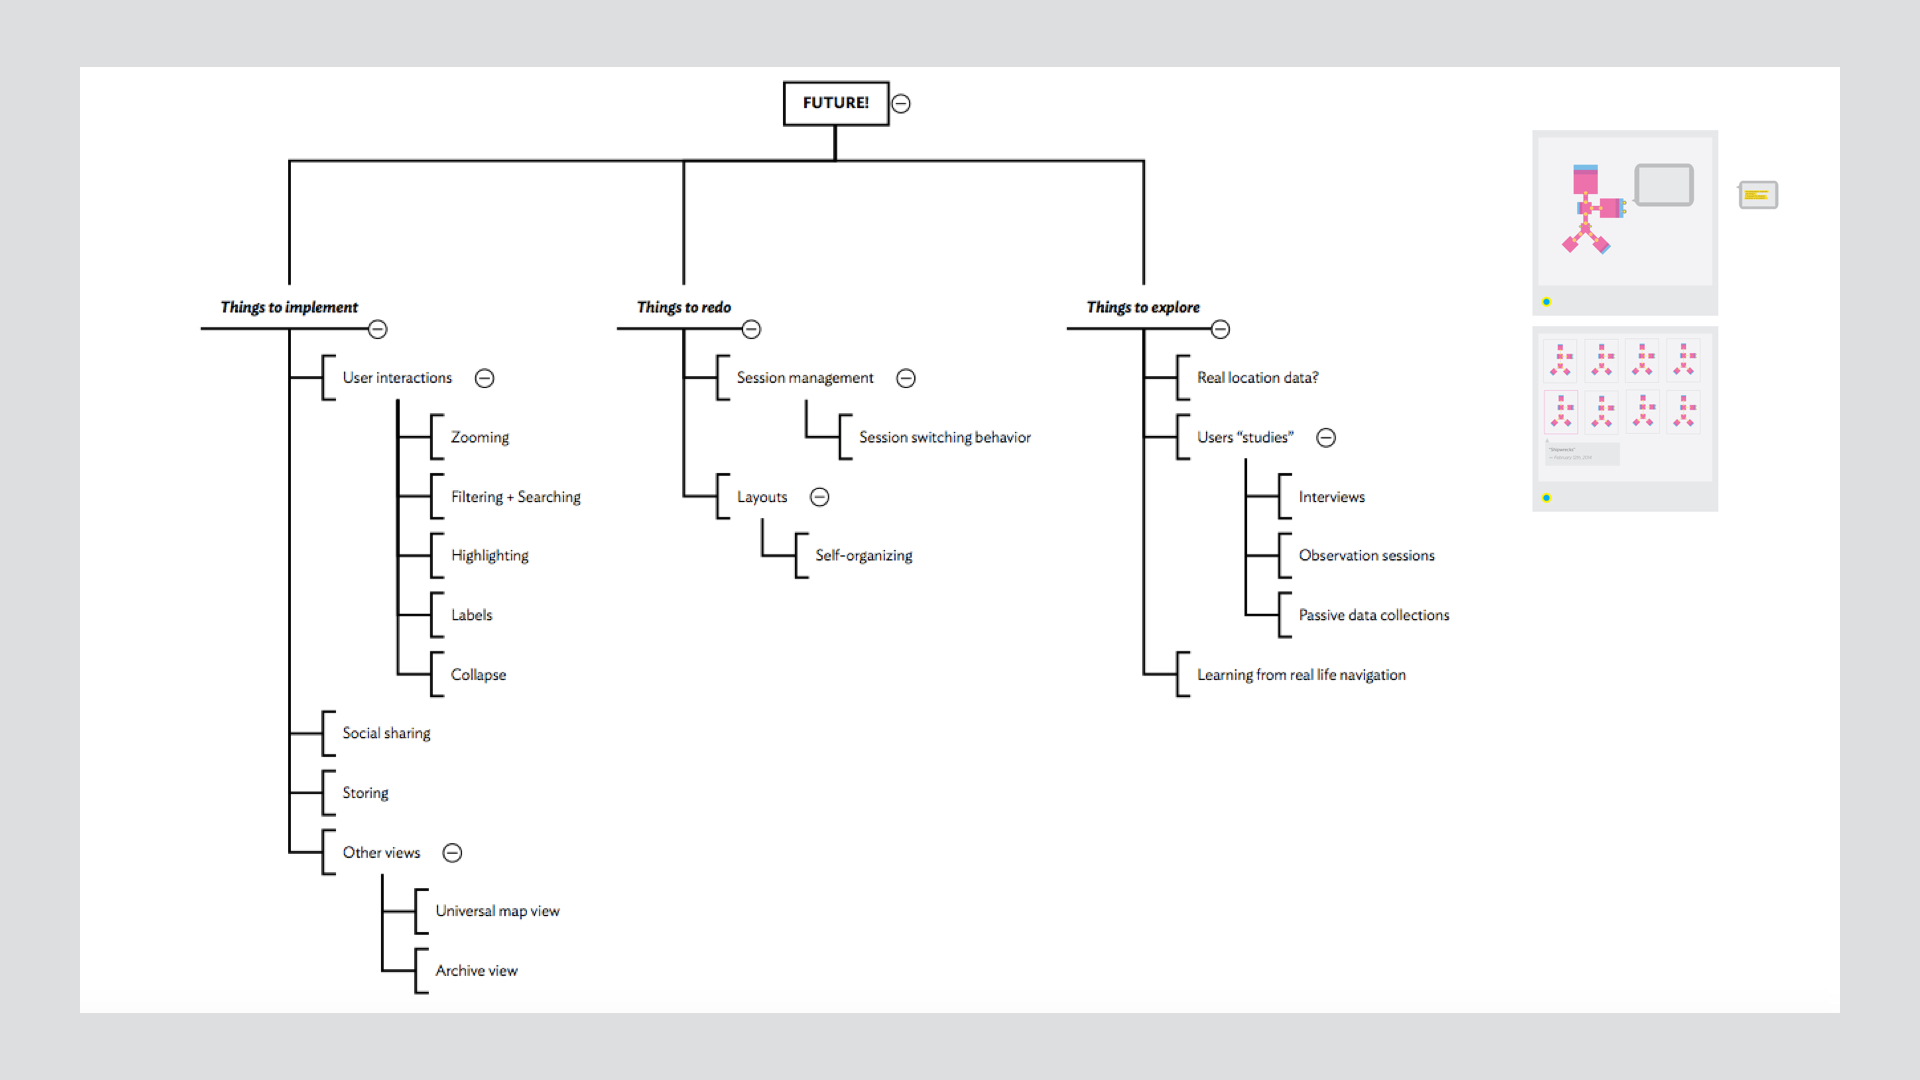
What about the future, you ask? The future sounds exciting.
For the last 8 years, I have been collecting records of every song I listened to, whether it was on a (now so precious) iPod, my personal computer, or my phone.
If this sounds obsessive, it is not. In truth, I made no effort other than creating a last.fm account, downloading every “scrobbling” solution they provide, and restricting my streaming and non-streaming activity to supported platforms (hello Rdio). However, a simple list of songs to which one has listened to is not much of an insight-generating dataset. Using the echoNest APIs, I chose to supplement every song or artist I have listened to with metadata about the type of artist they are, and the kind of sound their music is.
If this sounds vain, well, it is. I can’t claim it is not. It is, however, an experiment that can be replicated universally. There are all sorts of insight we can learn about the way we go about our lives through the characteristics of the music we listen to. For instance, what kind of narrative can the tempo of the music characterising a period of our lives tell? Can change in musical taste be quantified, and more importantly, be used to document periods of our lives?
The first thing I wanted to investigate is whether there exists a clustering, or in other words, a community structure to the artists I listened to. Using the similarity parameters provided by the echoNest APIs, I came up with the below graph.
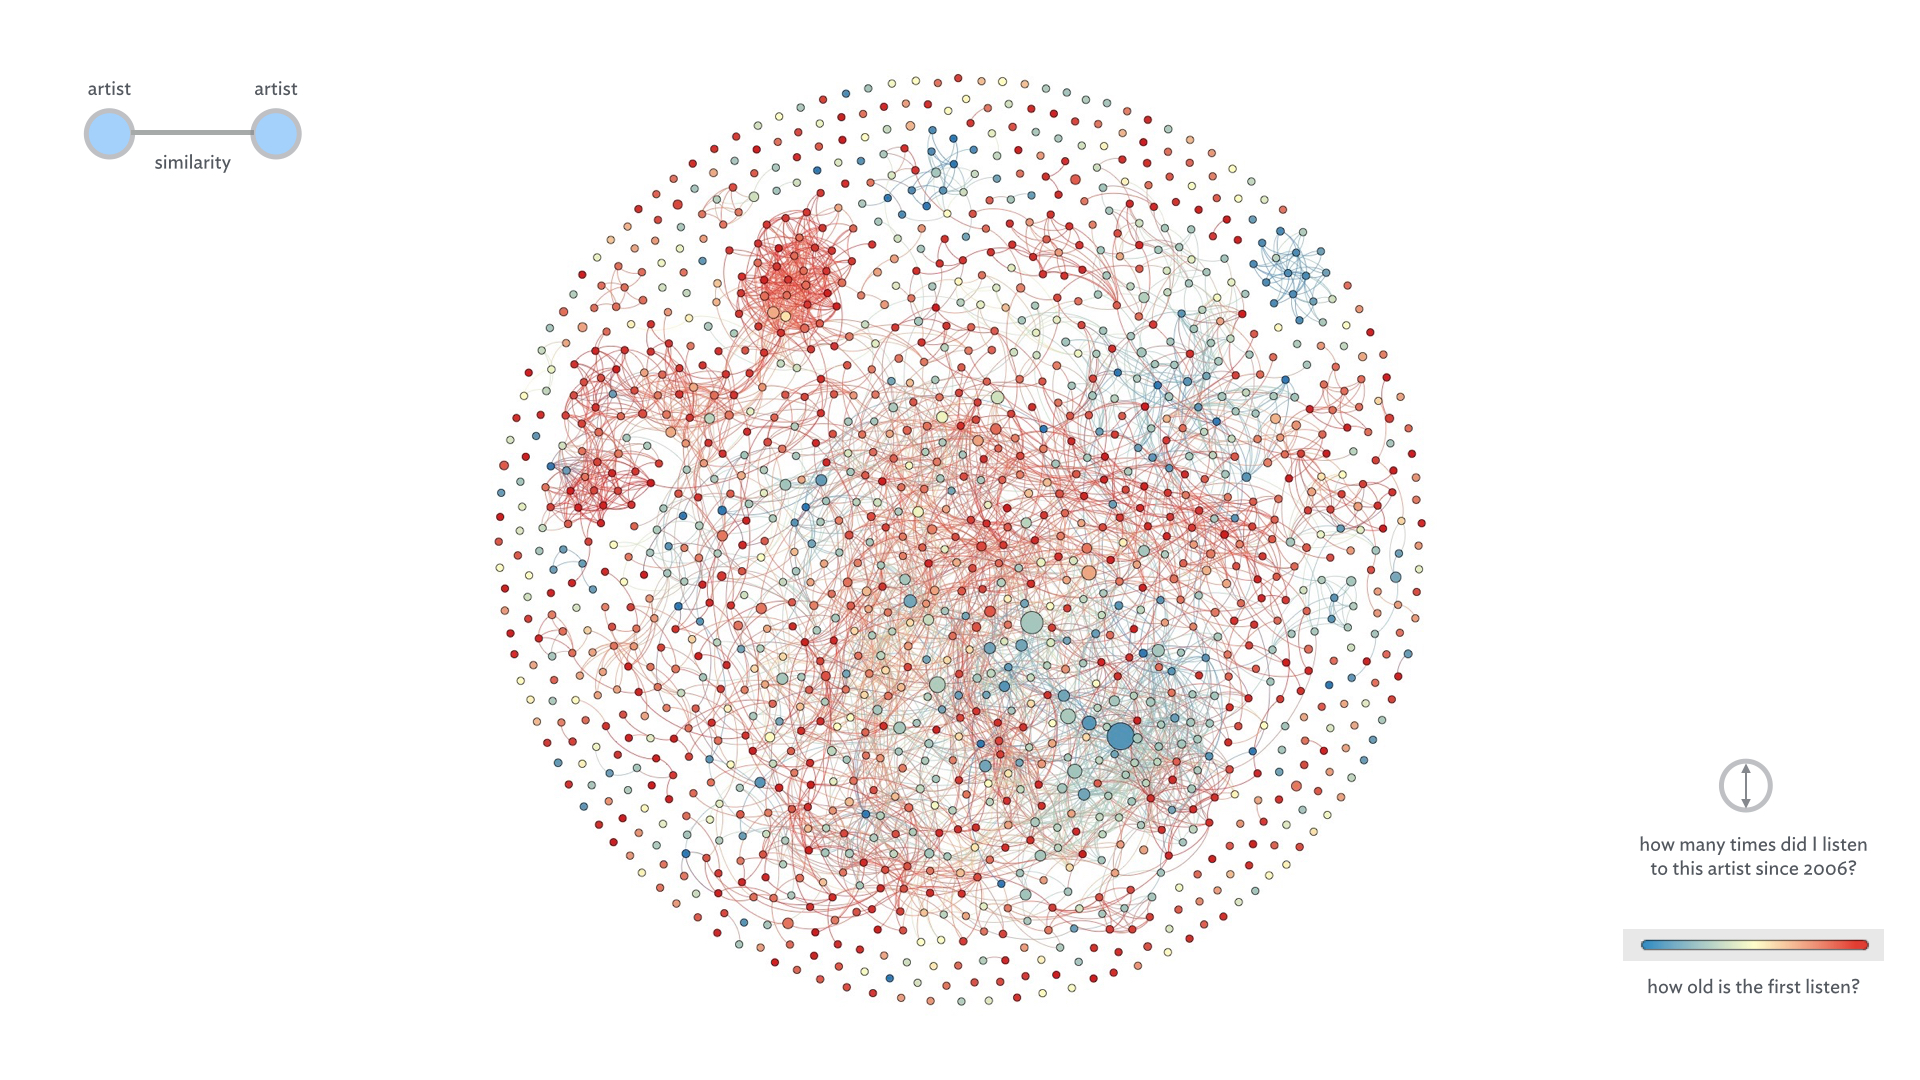
Each node is an artist, and the size of it is the number of times I listened to that artist in the period in question. The redder the color of the node is, the more recently I started to listen to them.
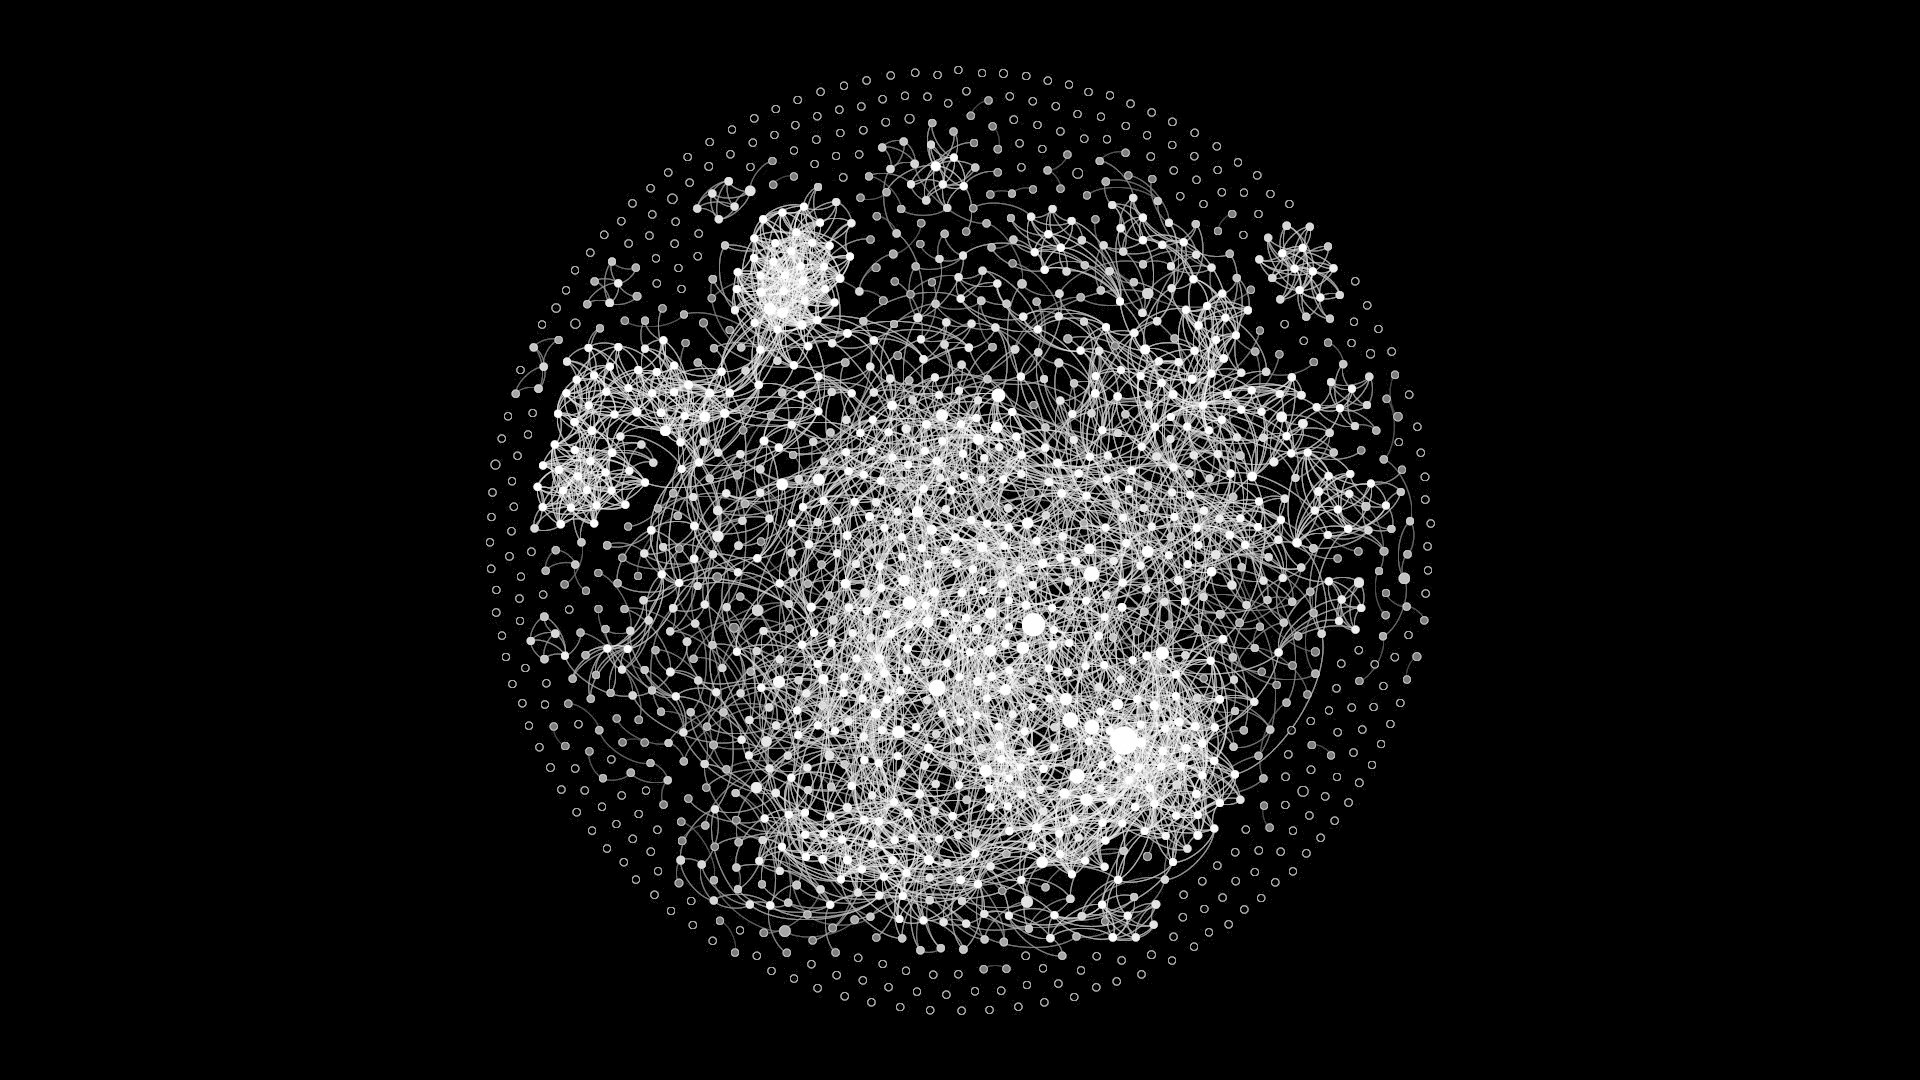
It is visually obvious that there are a number of clusters of artists in the graph. A black-and-white variation of the graph makes that more apparent.
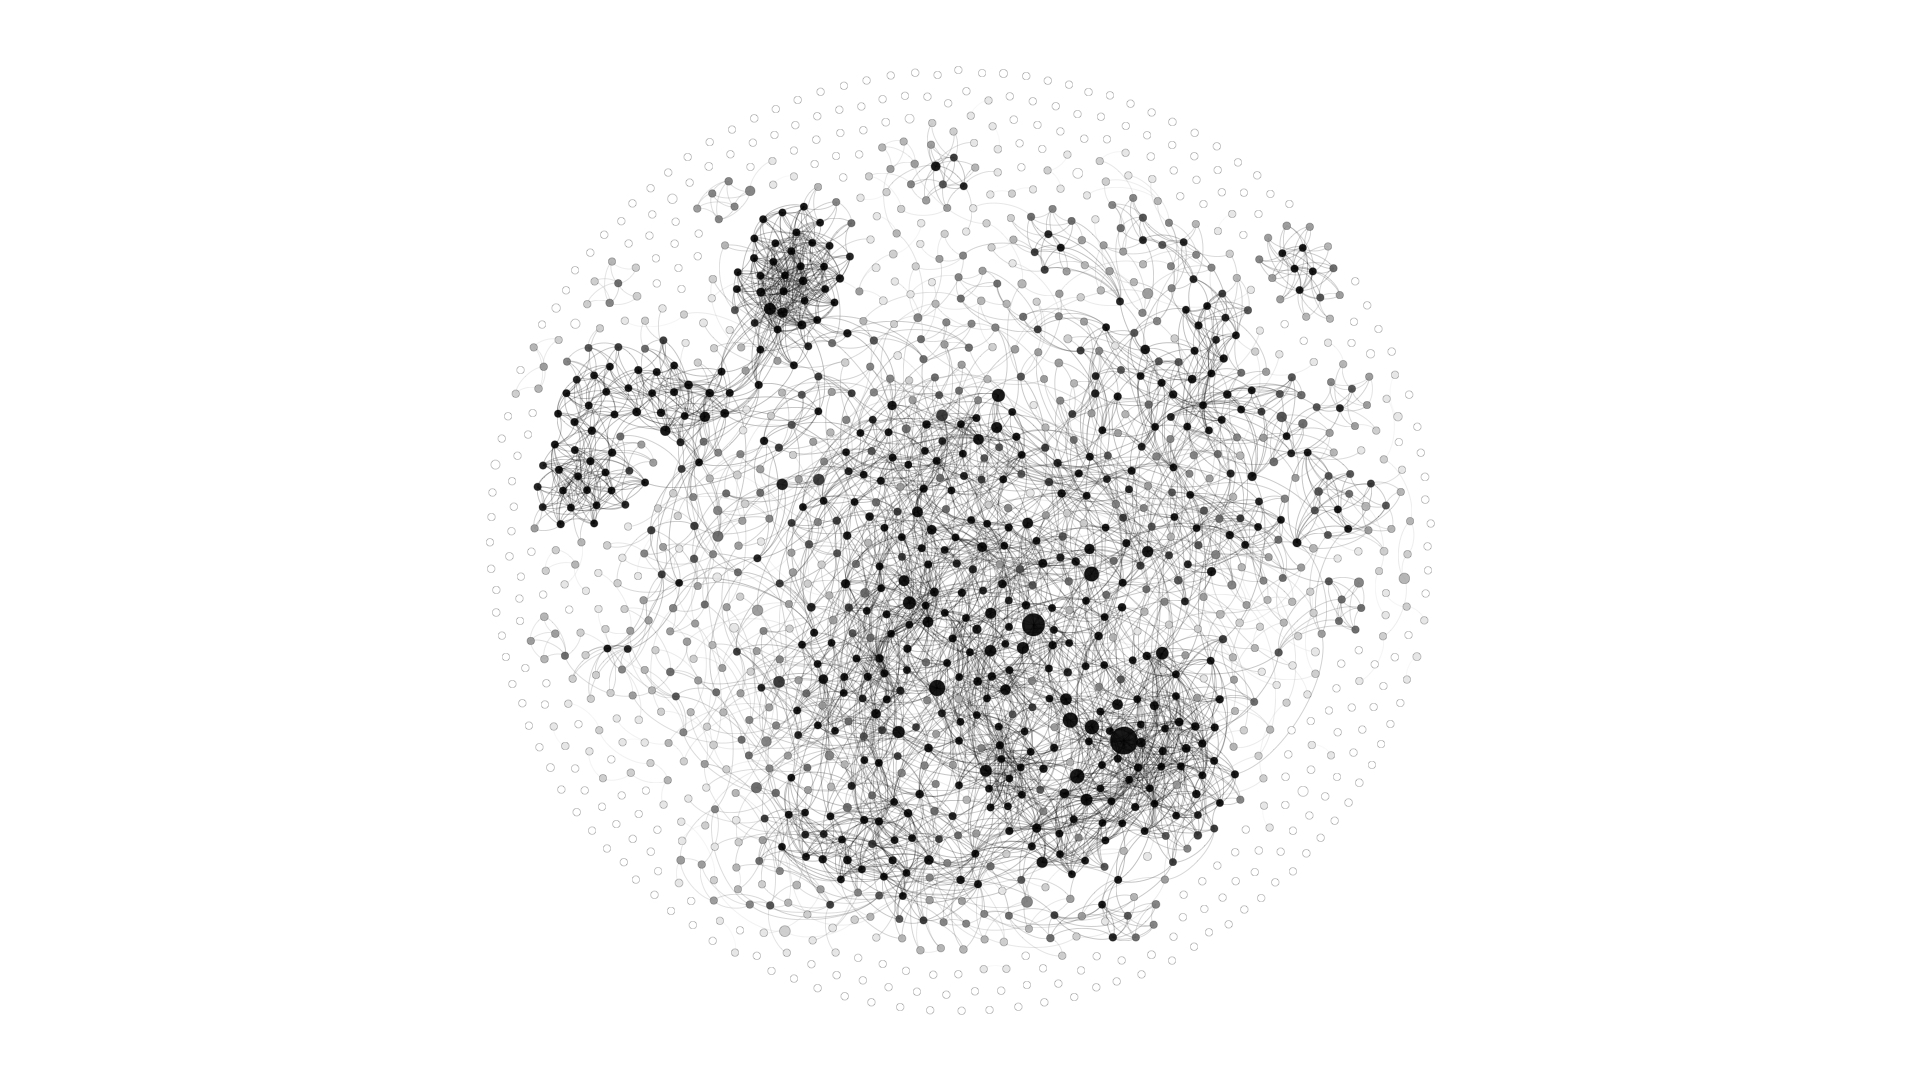
After examining the actual nodes to comprehend what type of artists each cluster comprises, I annotated the graph as is shown below
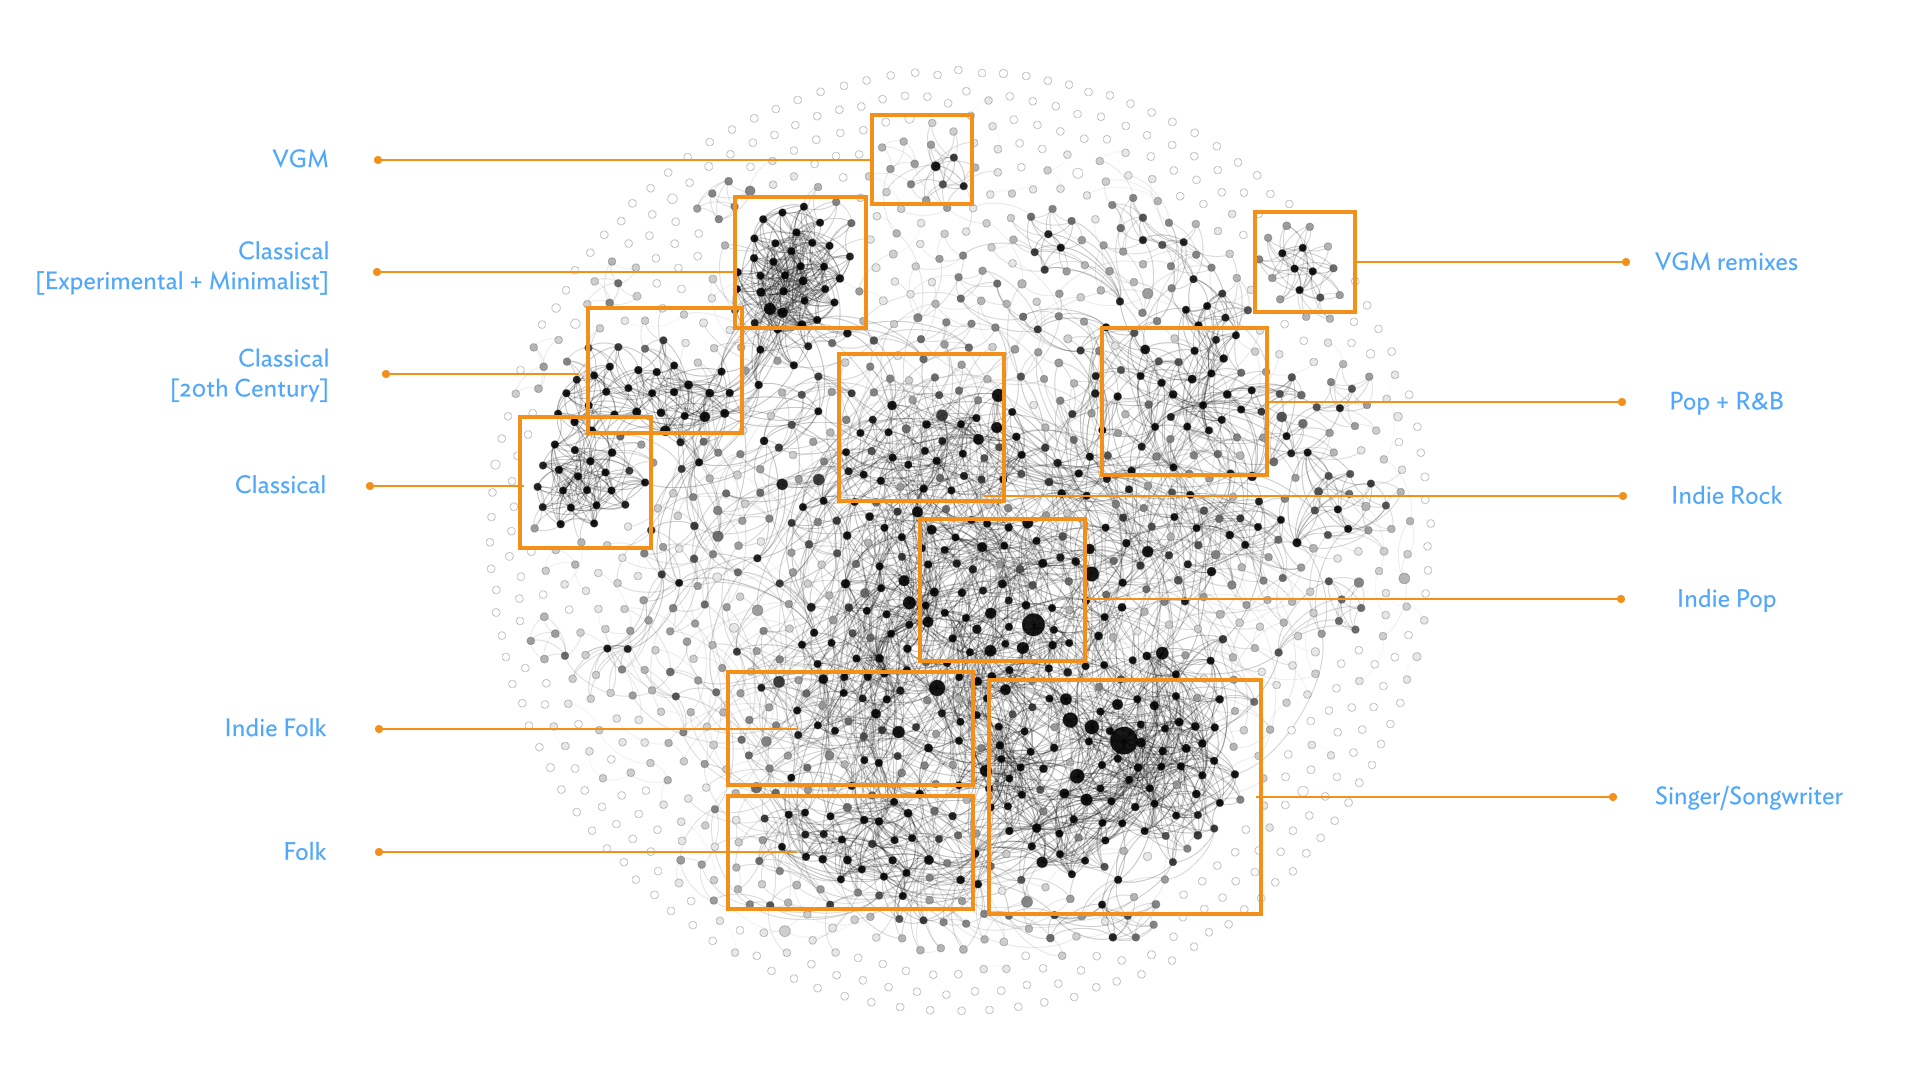
The most interesting aspect to the above is that there is a comprehensible, rational gradation between the genre-clusters. For example, both Folk and Indie Pop stem from the Singer/Songwriter cluster. Video game music (VGM) is closer in nature to the more experimental works of Classical music (e.g. Hauschka and Max Richter).
Next, I wanted to see whether there exists a pattern in the music I listen to in terms of the artist origins.
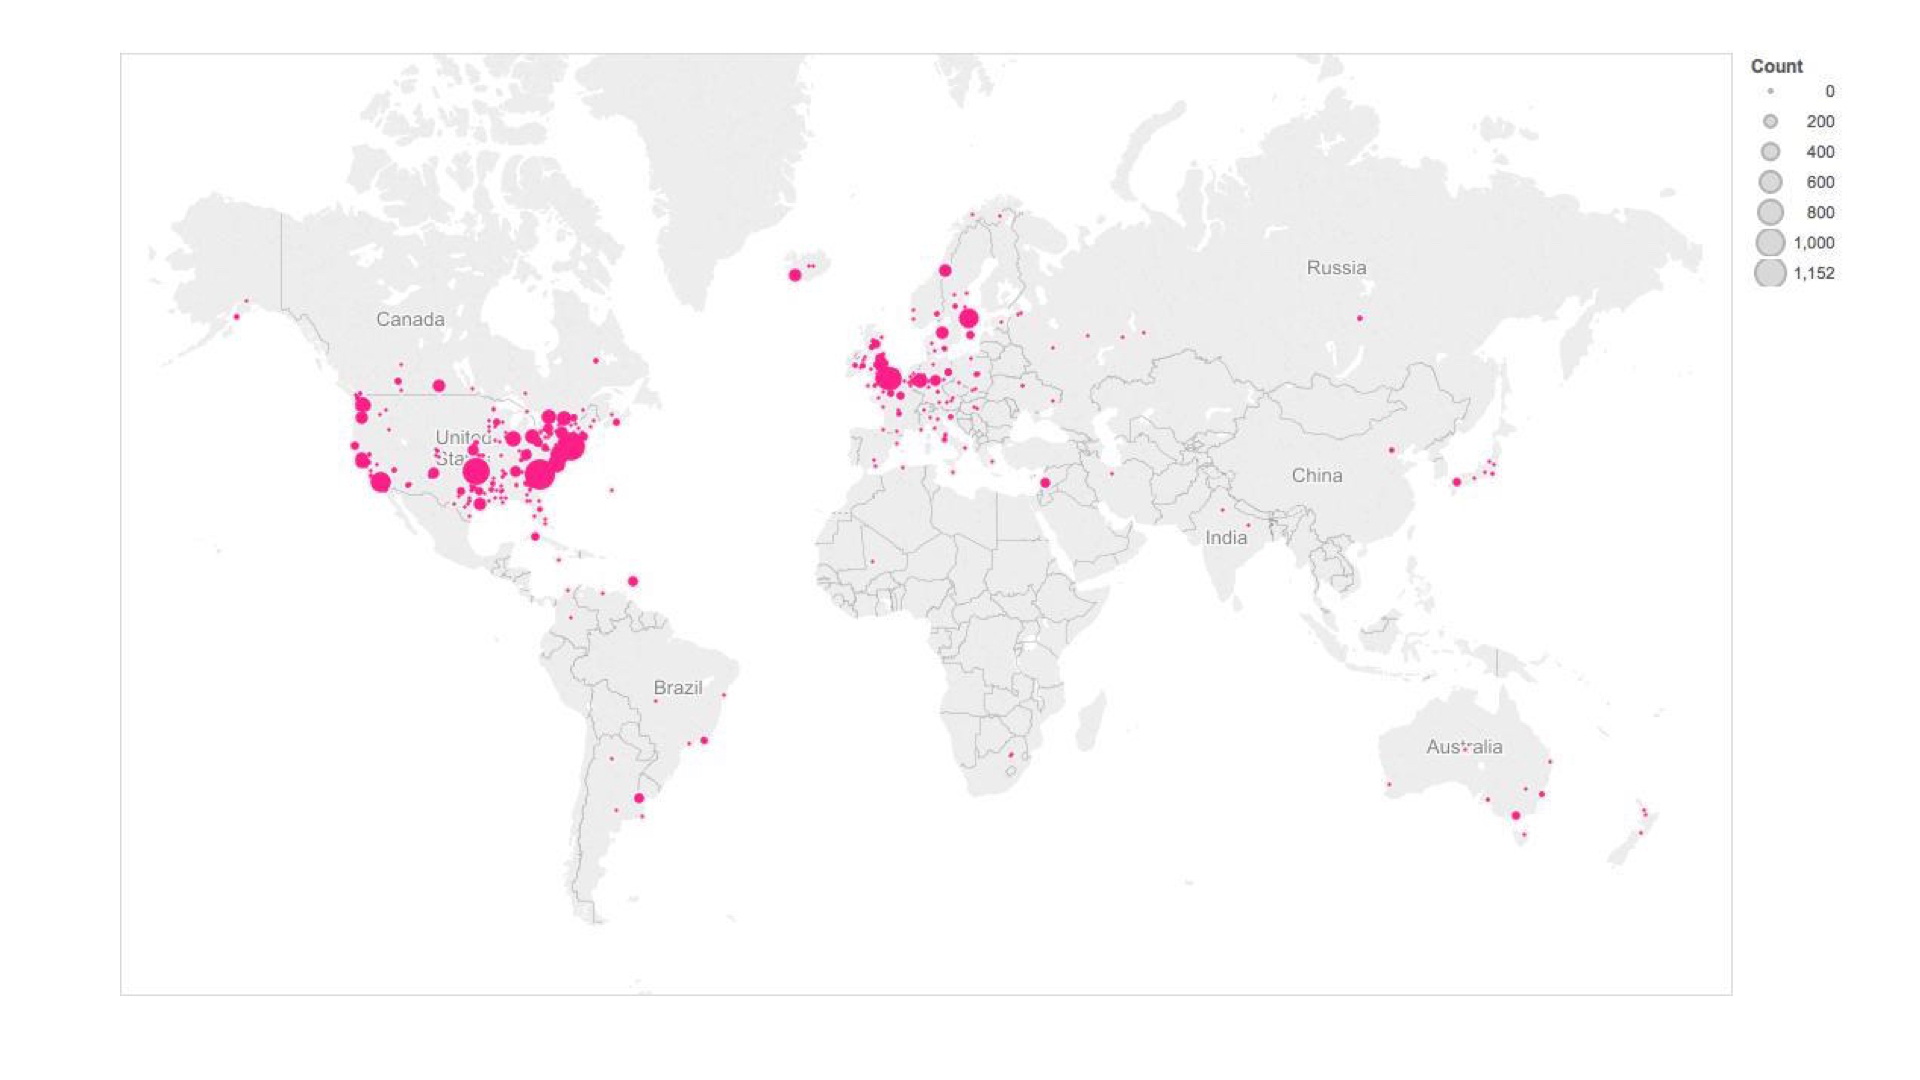
Unsurprisingly, most of the music I listen to is “western” in nature, i.e. from Europe and Northern America.
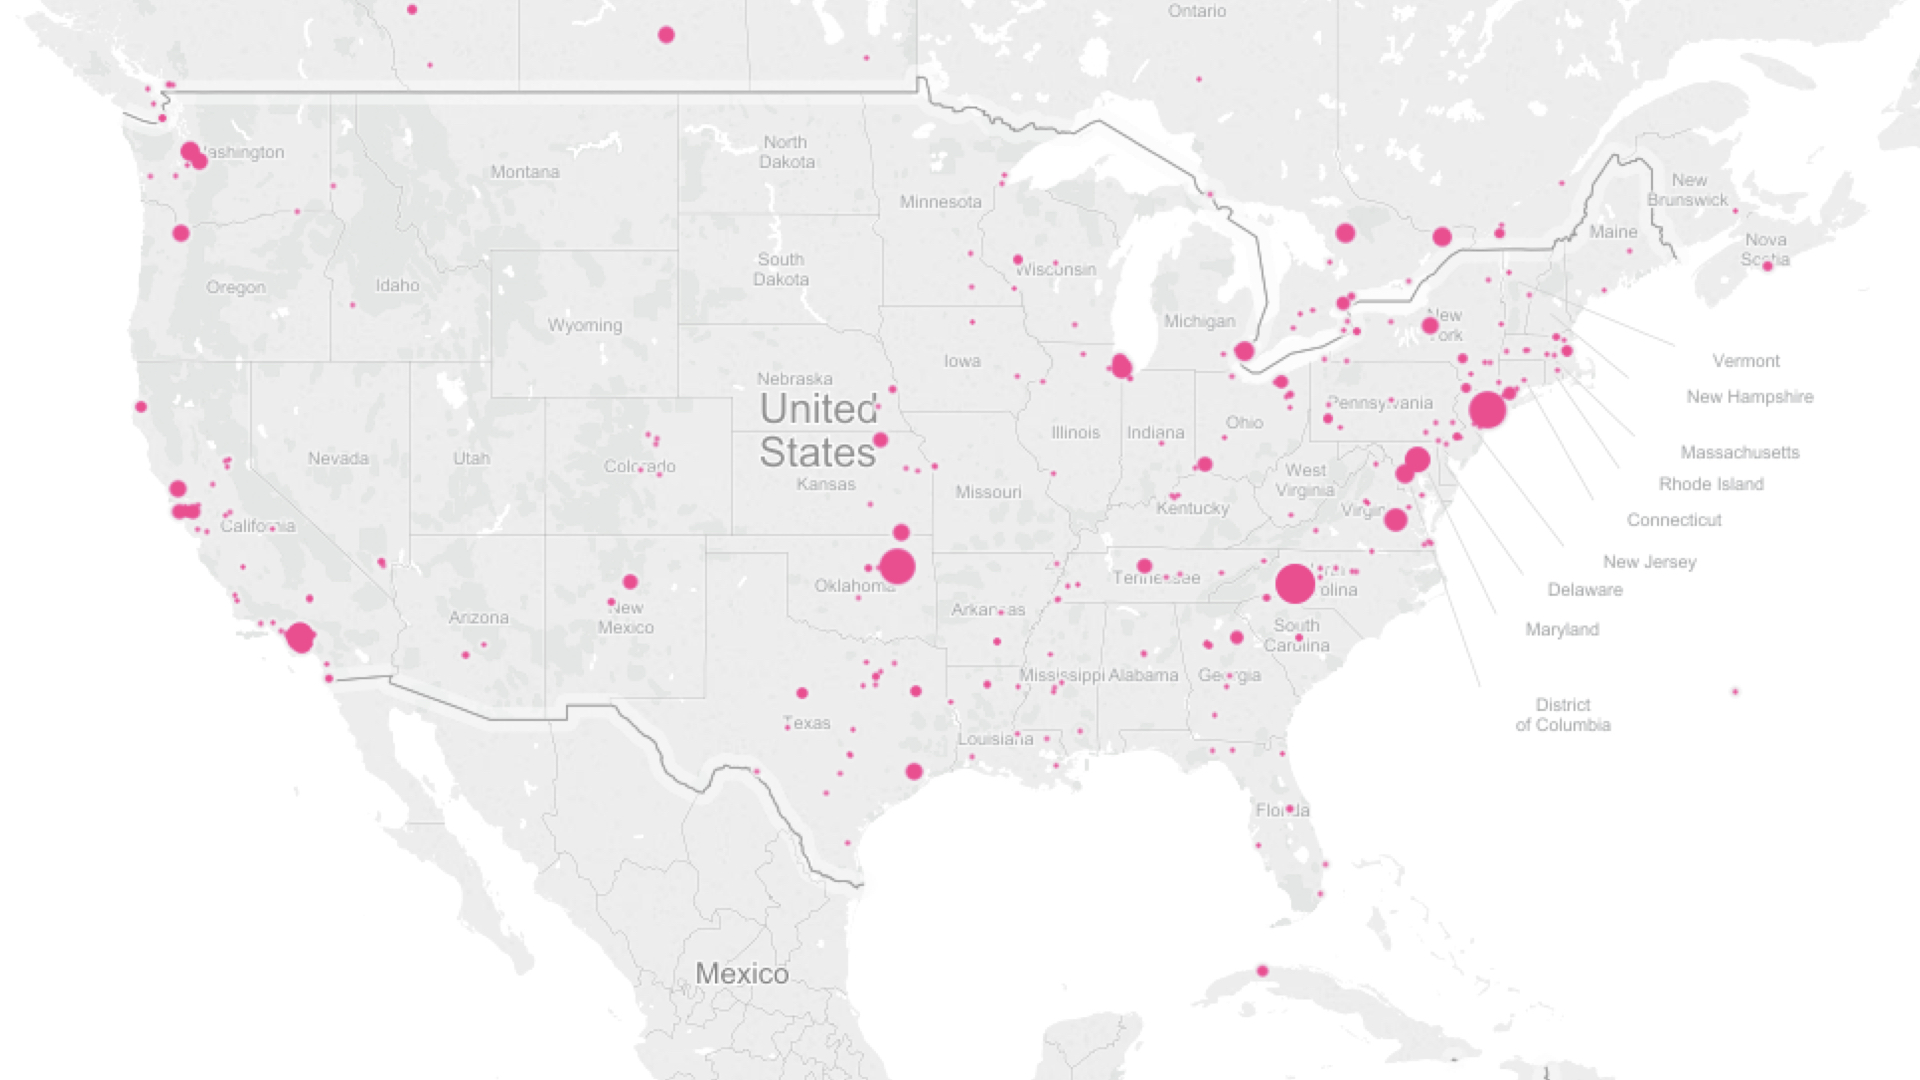
Specifically, the artists I listen to tend to come from coastal USA. For instance, Tori Amos, my most listened to artist in the period of question, is the large dot on North Carolina.
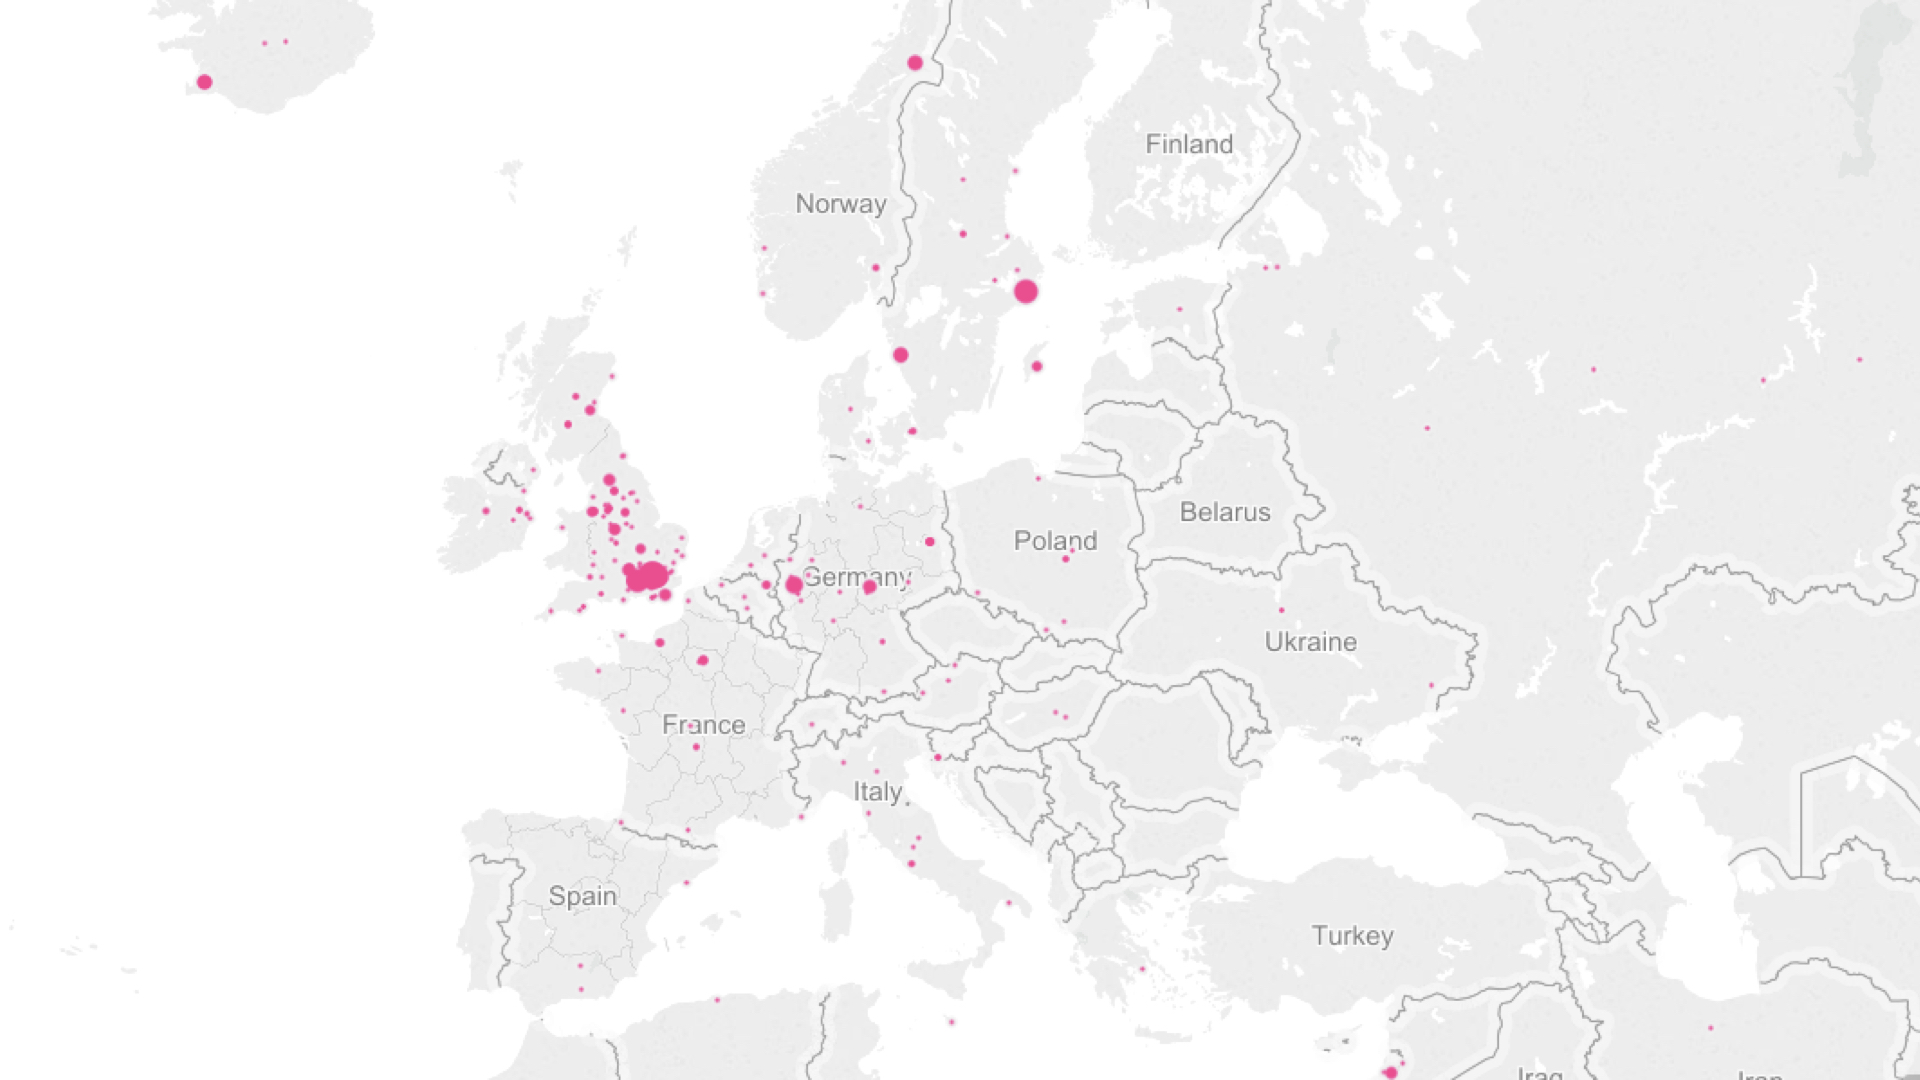
I listen to too many obscure Swedish artists (e.g. Nina Kinert, Anna Ternheim, Tomas Barfod, and Ane Brun), and it shows. Non-Scandinavian, non-Britain Europe is mostly where the classical composers I listen to come from. Also, please note the large dot on Iceland up north. This is Bjork, of course.

To get a kind of micro-view of my tastes, the below is the distribution of the musical acts I listen to. The size of the rectangles are proportional to the numbers of listens, whereas the darkness of the green color indicates how familiar the act is. “Familiar” as in how well known they are to the mainstream.
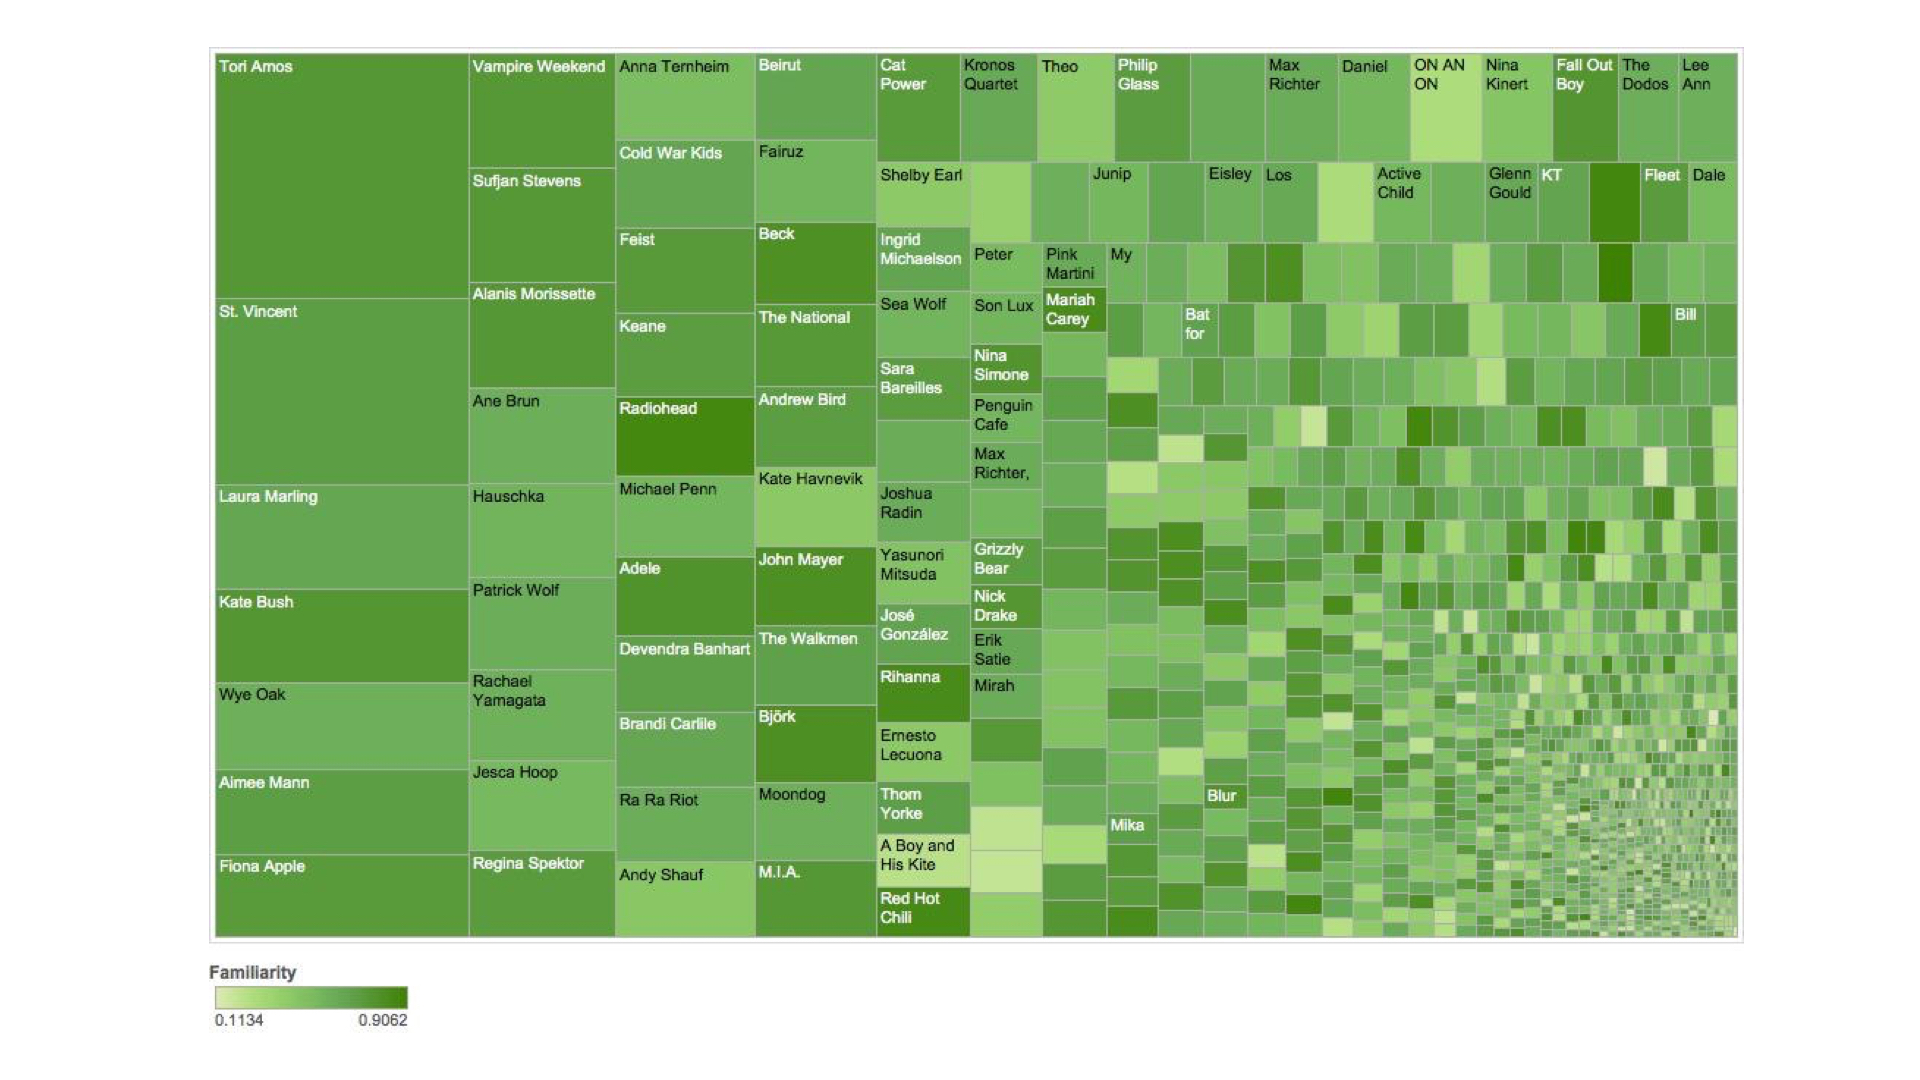
The most apparent pattern is that I am heavily into female vocalist, mostly singer-songwriters, as well as indie pop/rock acts. The other observation is the huge number of artists that I listened to that have an abysmally low listens count.
The below histograms represent the distribution of the music I listen to in terms of energy, tempo, valence (as in the likelihood of the song to evoke a positive feeling), and “hotttnesss” (spelled like that, I kid you not). The latter is echoNest’s term for how hot the artist is commercially.
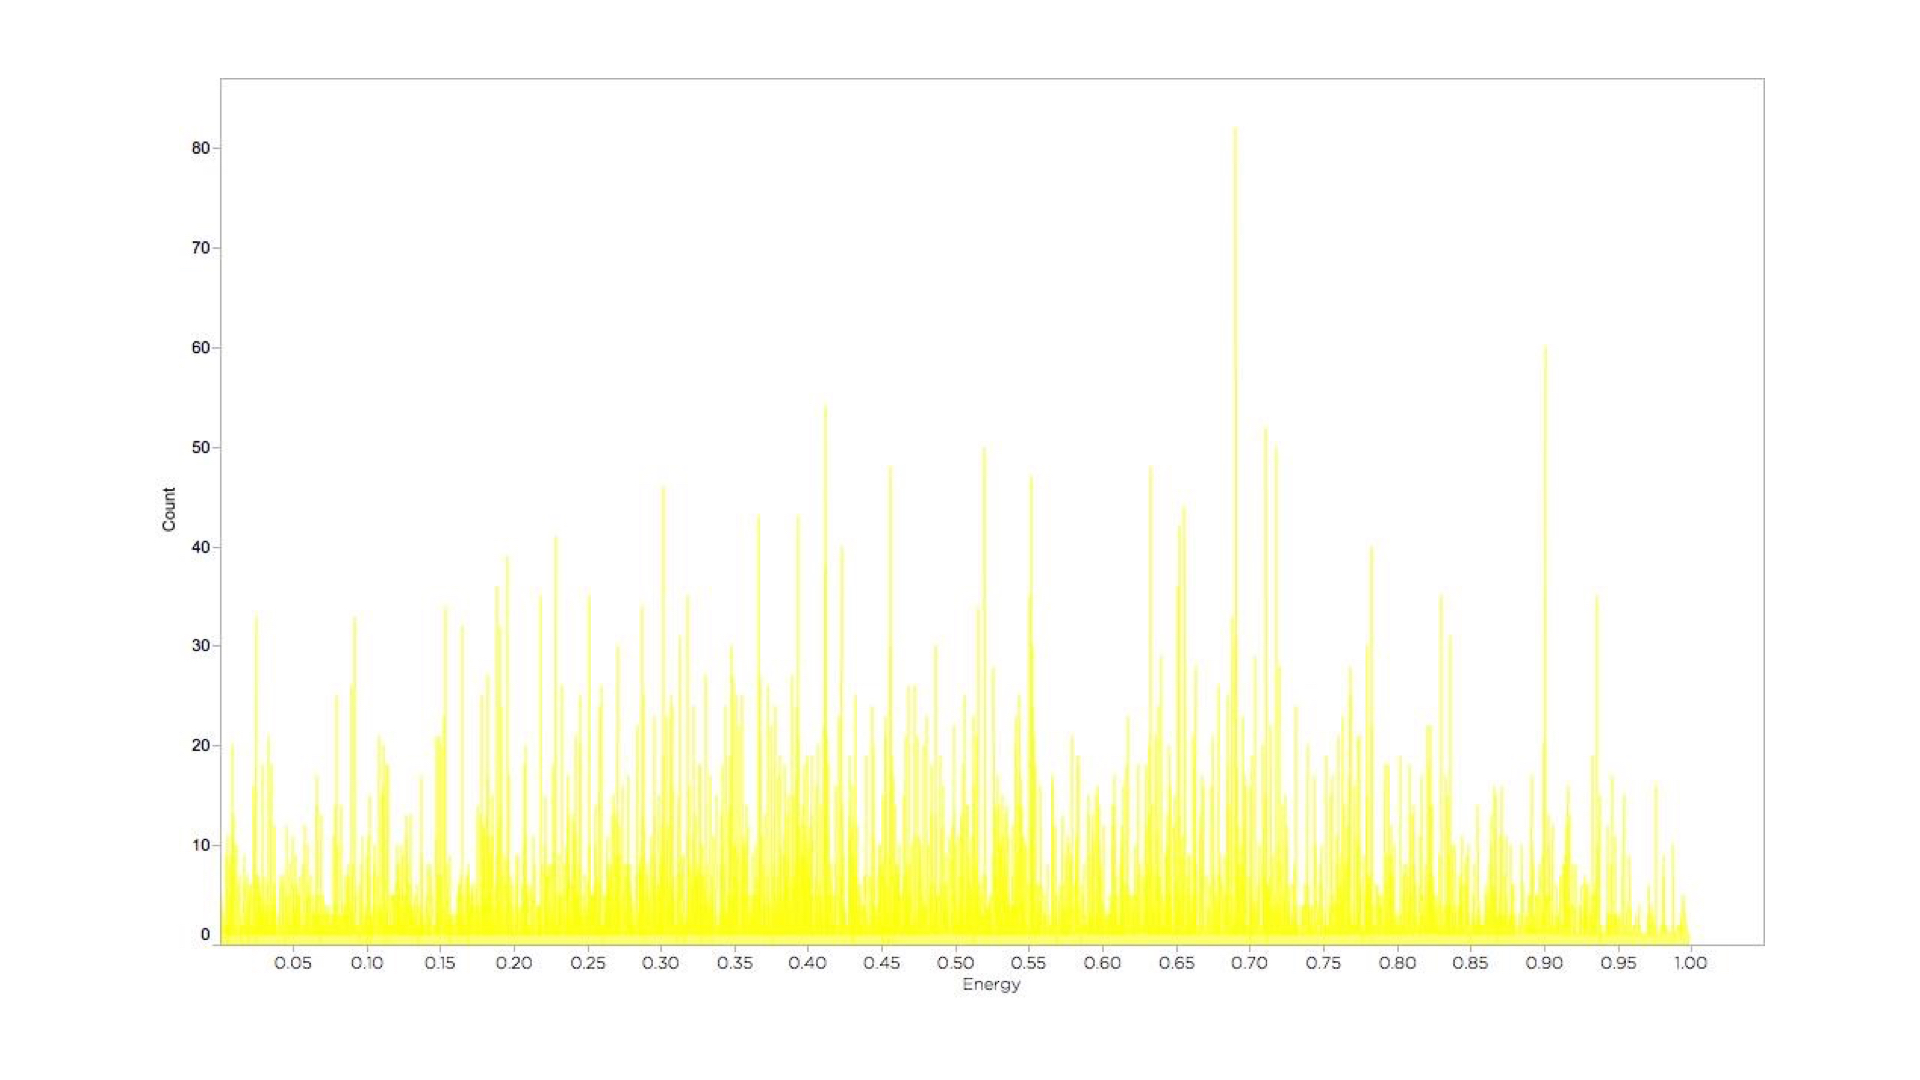
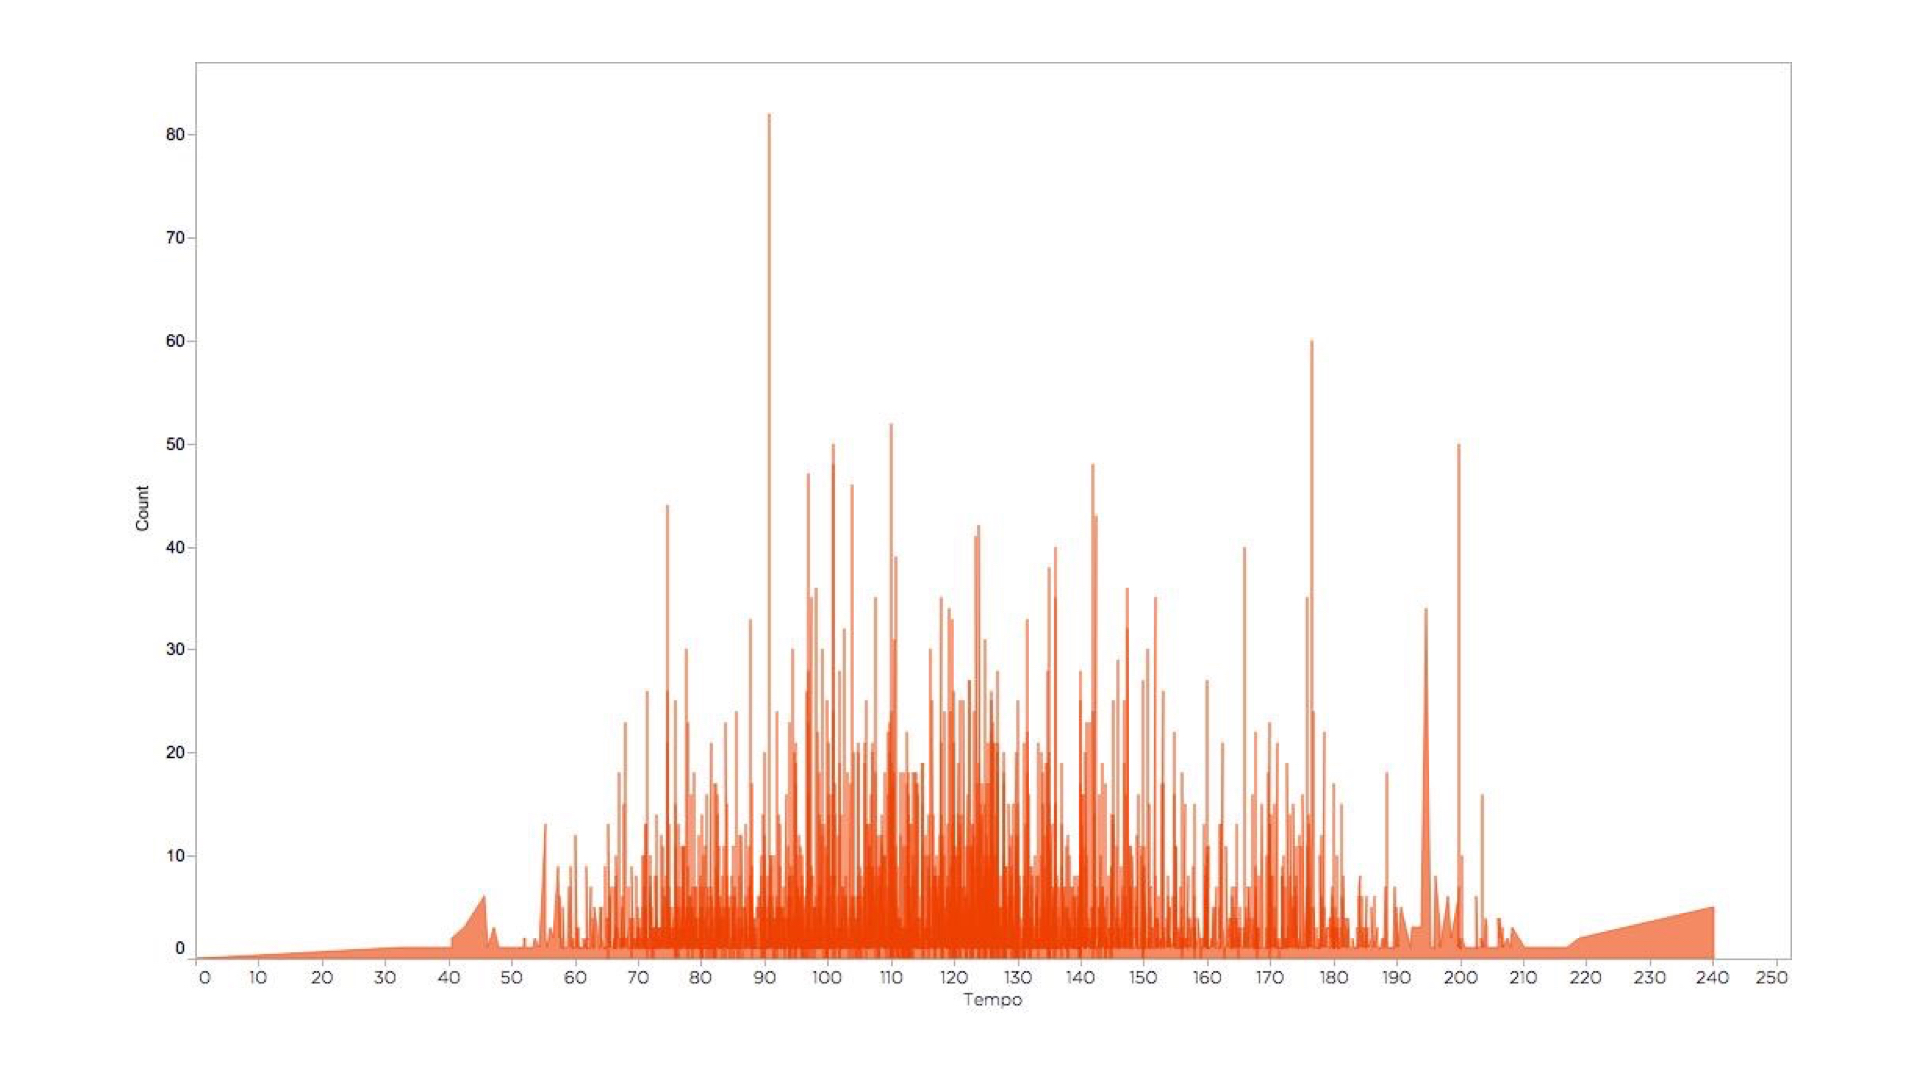
While there is no clear pattern to the energy of the music I listen to, most of my music is in the middle of the tempo spectrum. However, the API seem to exaggerate the tempo of some of the songs, as it is really hard to find songs that are 240 bpms.
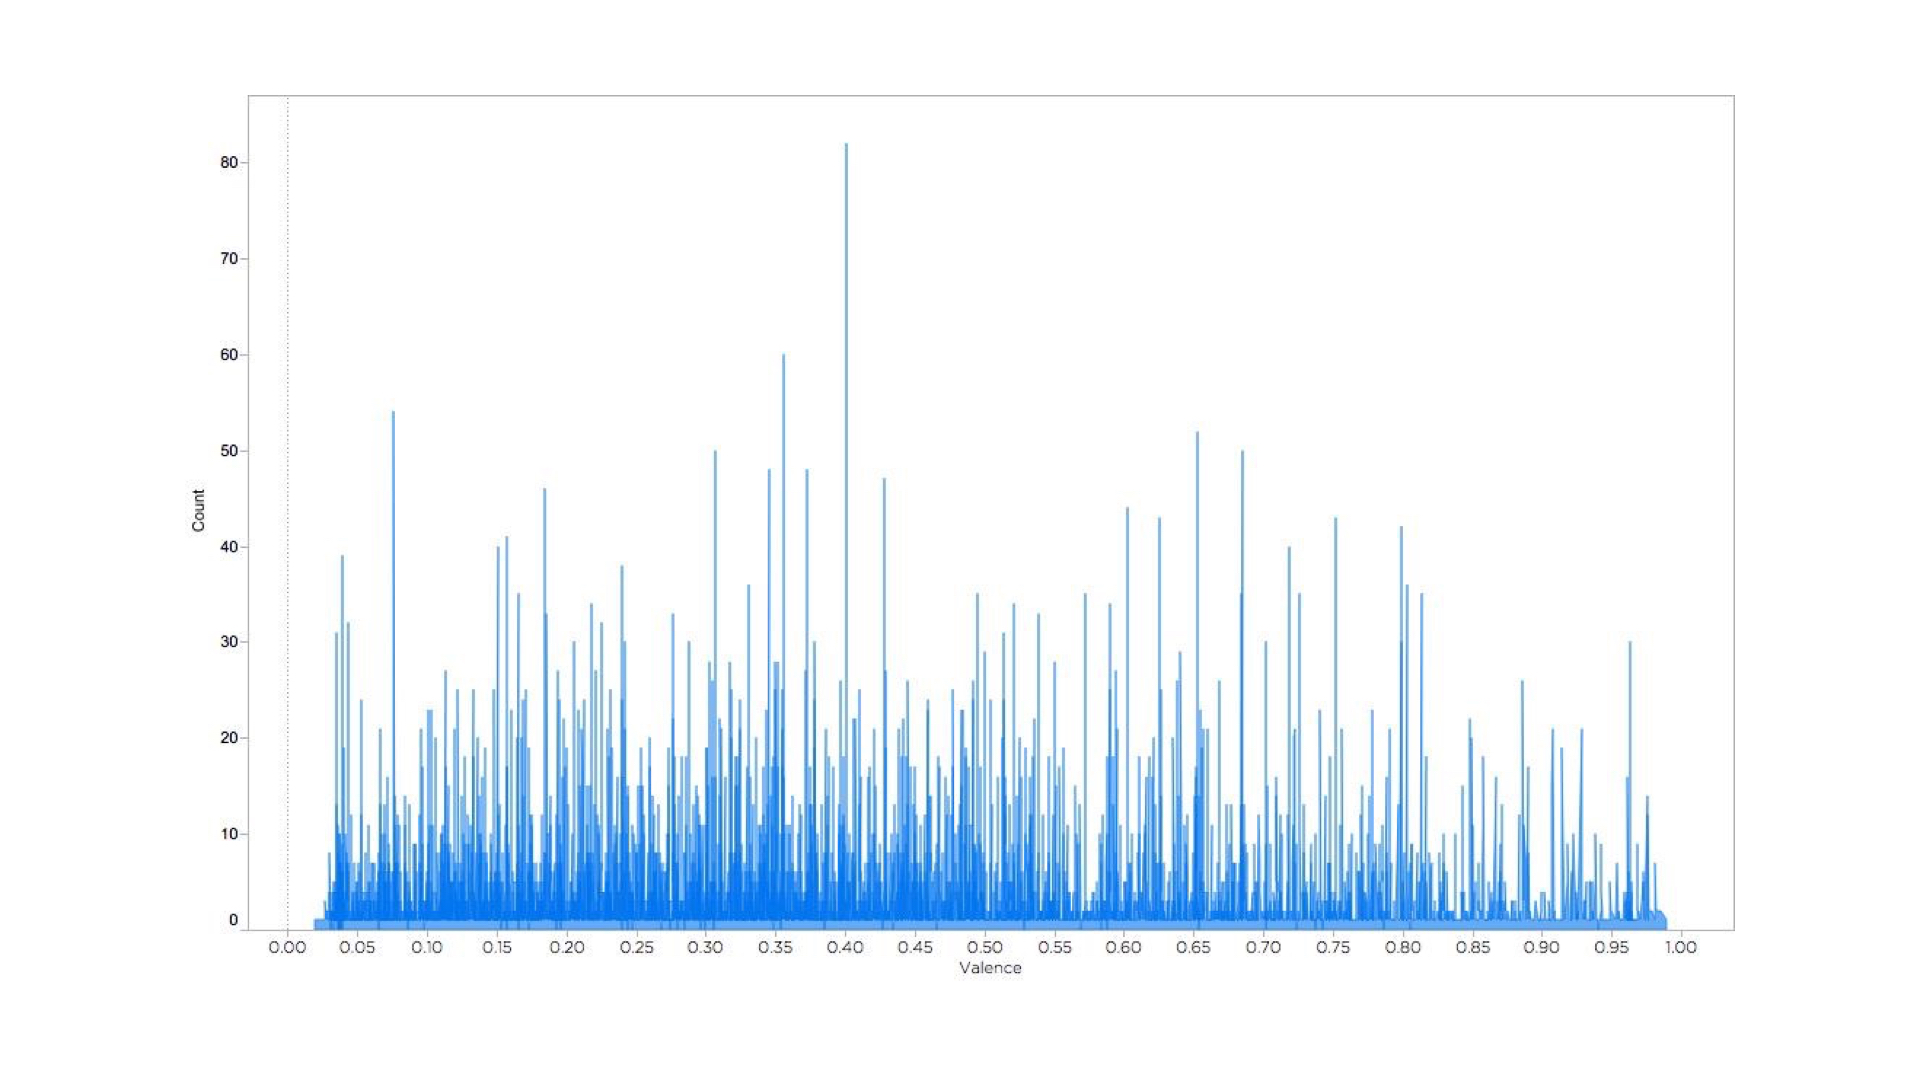
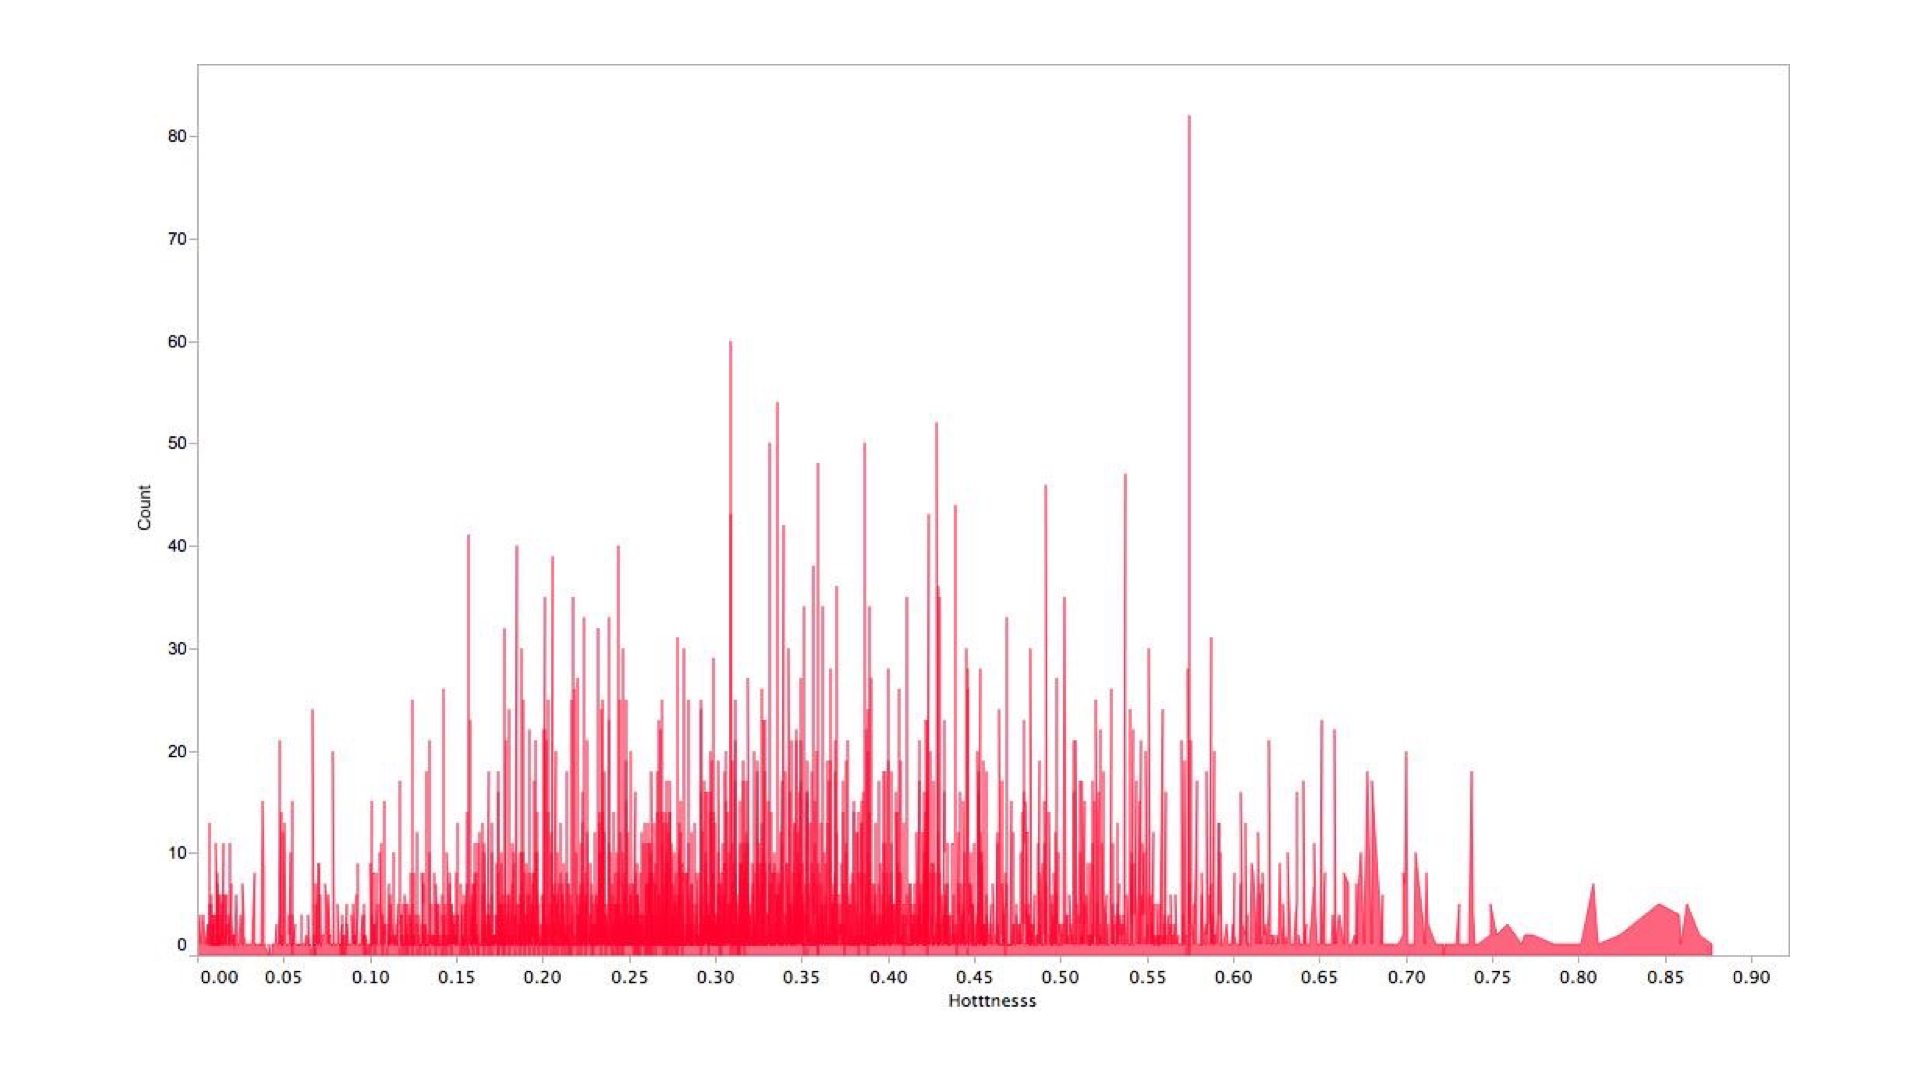
Thankfully, most of the music acts I listen to are below the average in terms of commercial hotness. The majority of my valence values are below 0.50, i.e. they are prone to evoke a sad feeling.
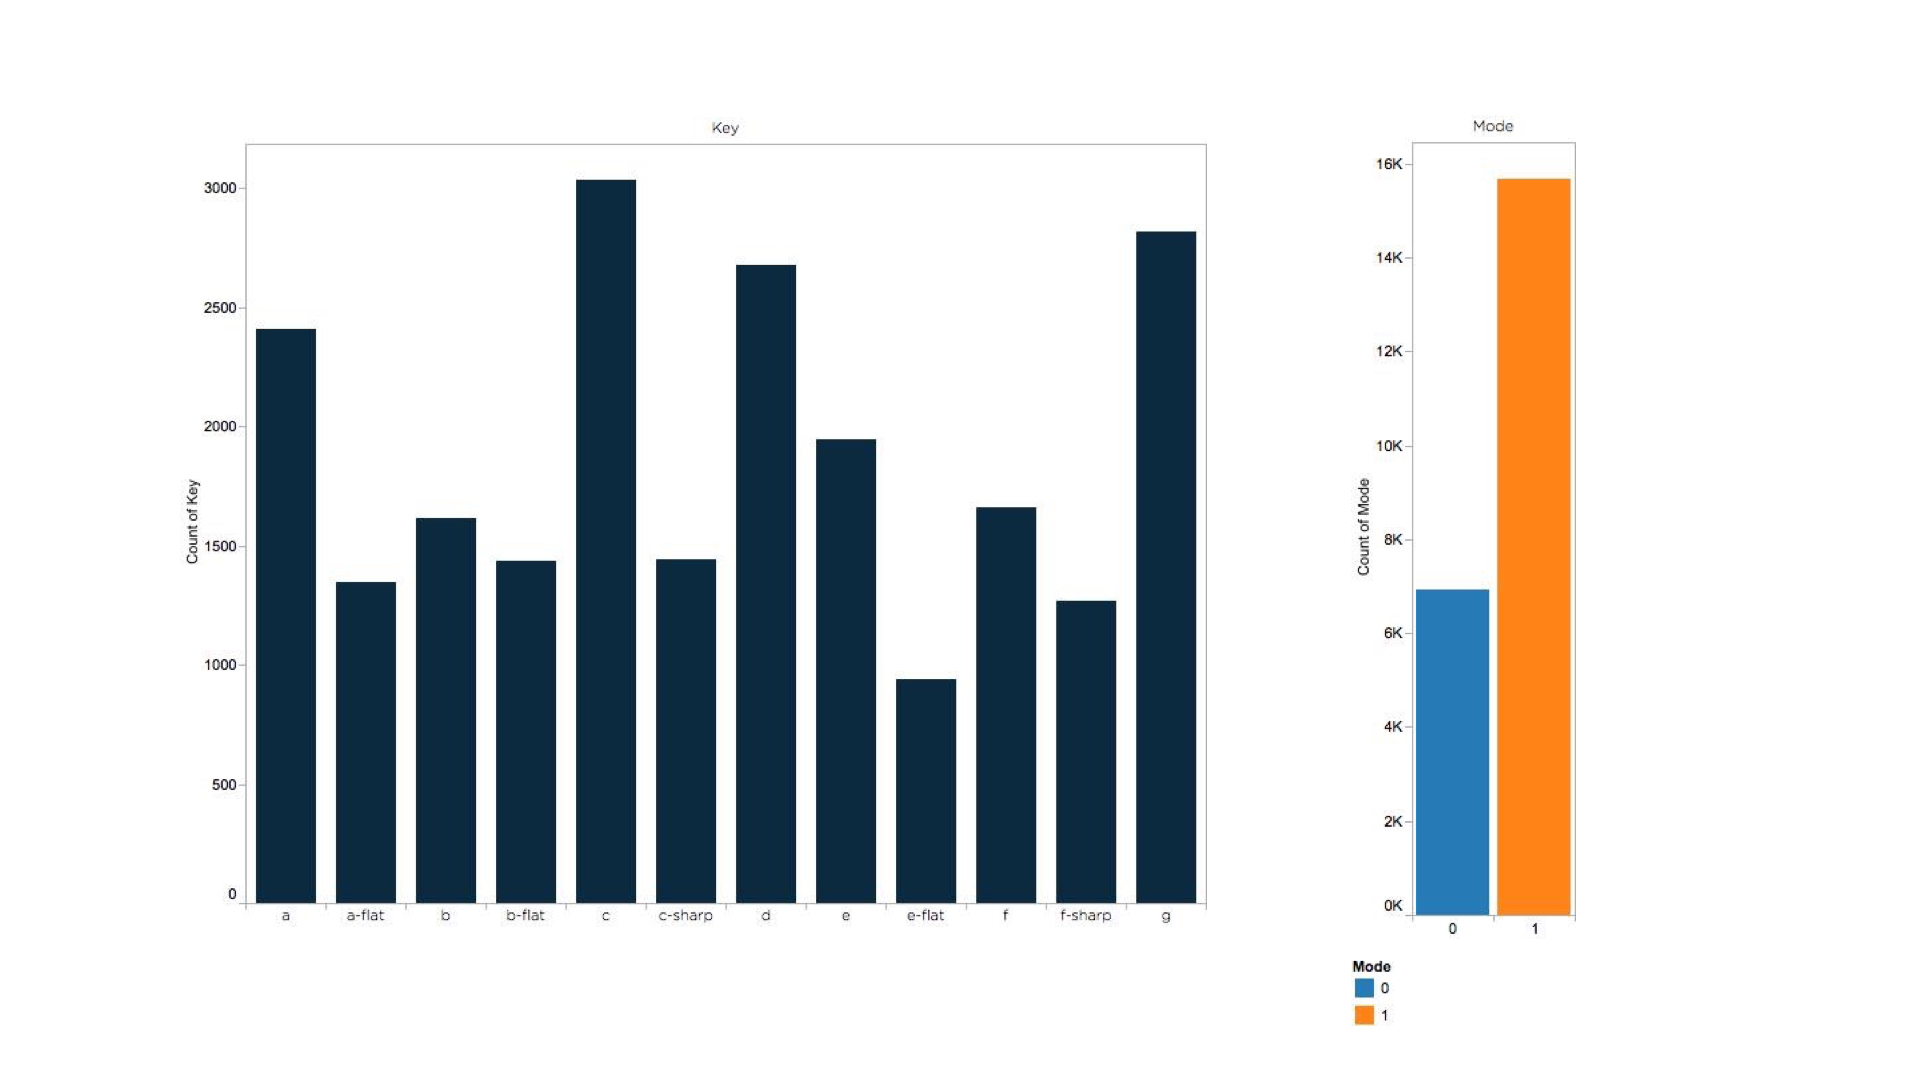
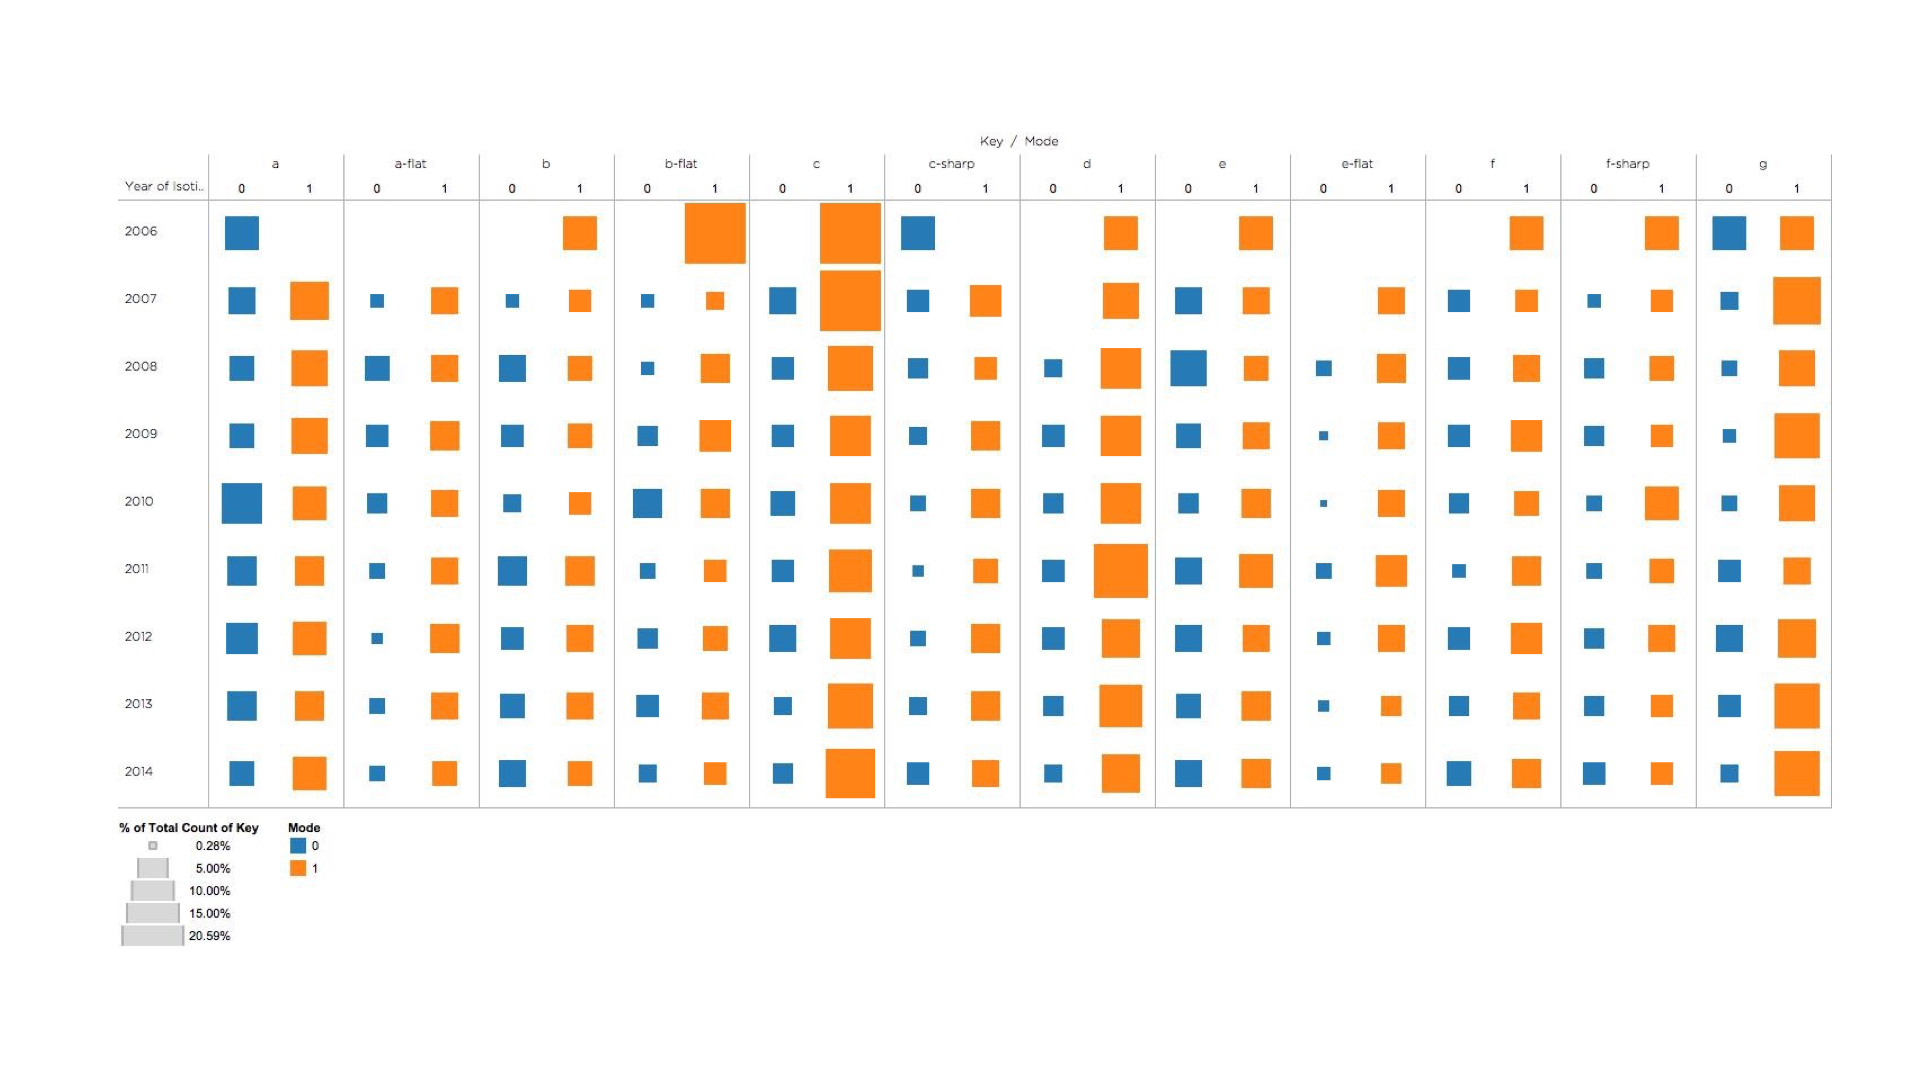
In terms of musical key, the majority of the music was in the a, c, d, and g keys. I listen to more music in the major key (more than 2/3 of all the music I listen to) than the minor one, which is an indication, according to the musicians I asked, of higher upbeatness.
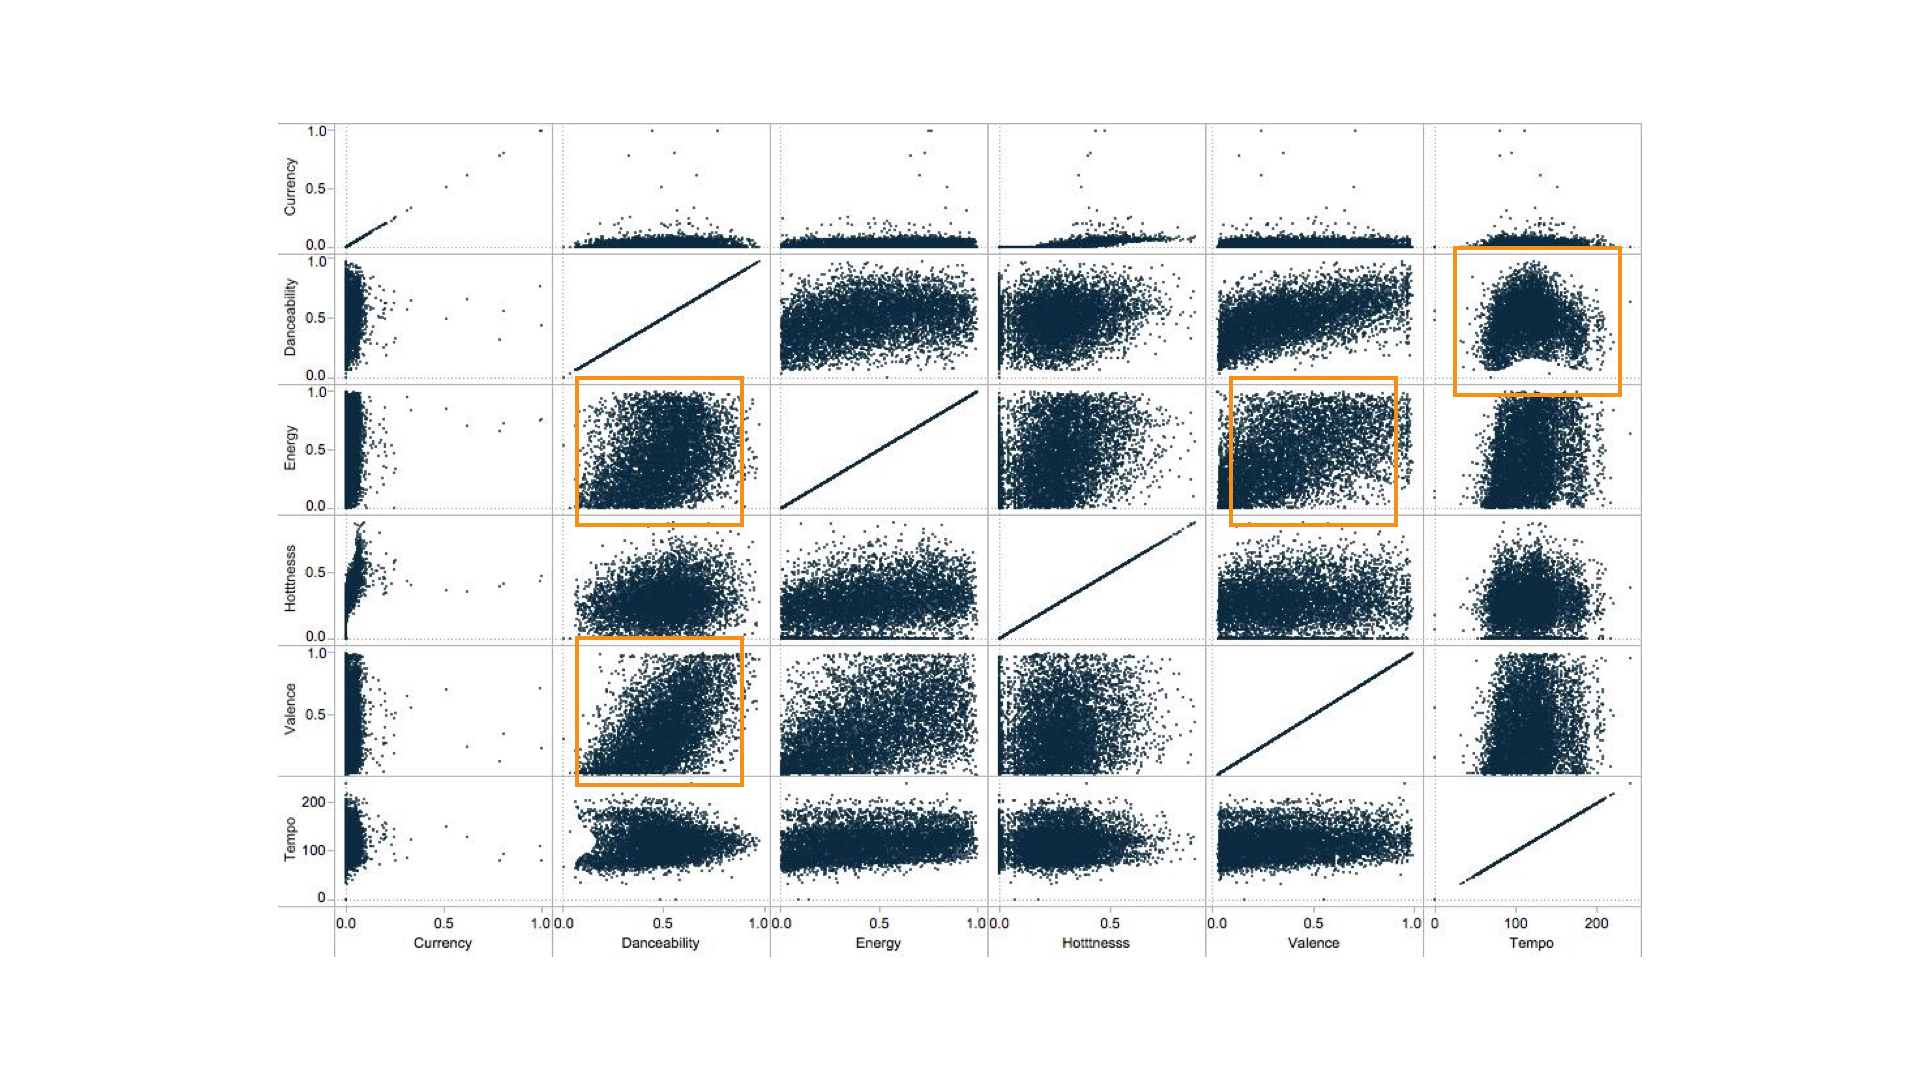
Using a matrix display of the above musical parameters, the most apparent correlation is the bell-curve-like graph of danceability versus valence. There also seems to be a positive correlation between danceability and energy, as well as valence and energy.

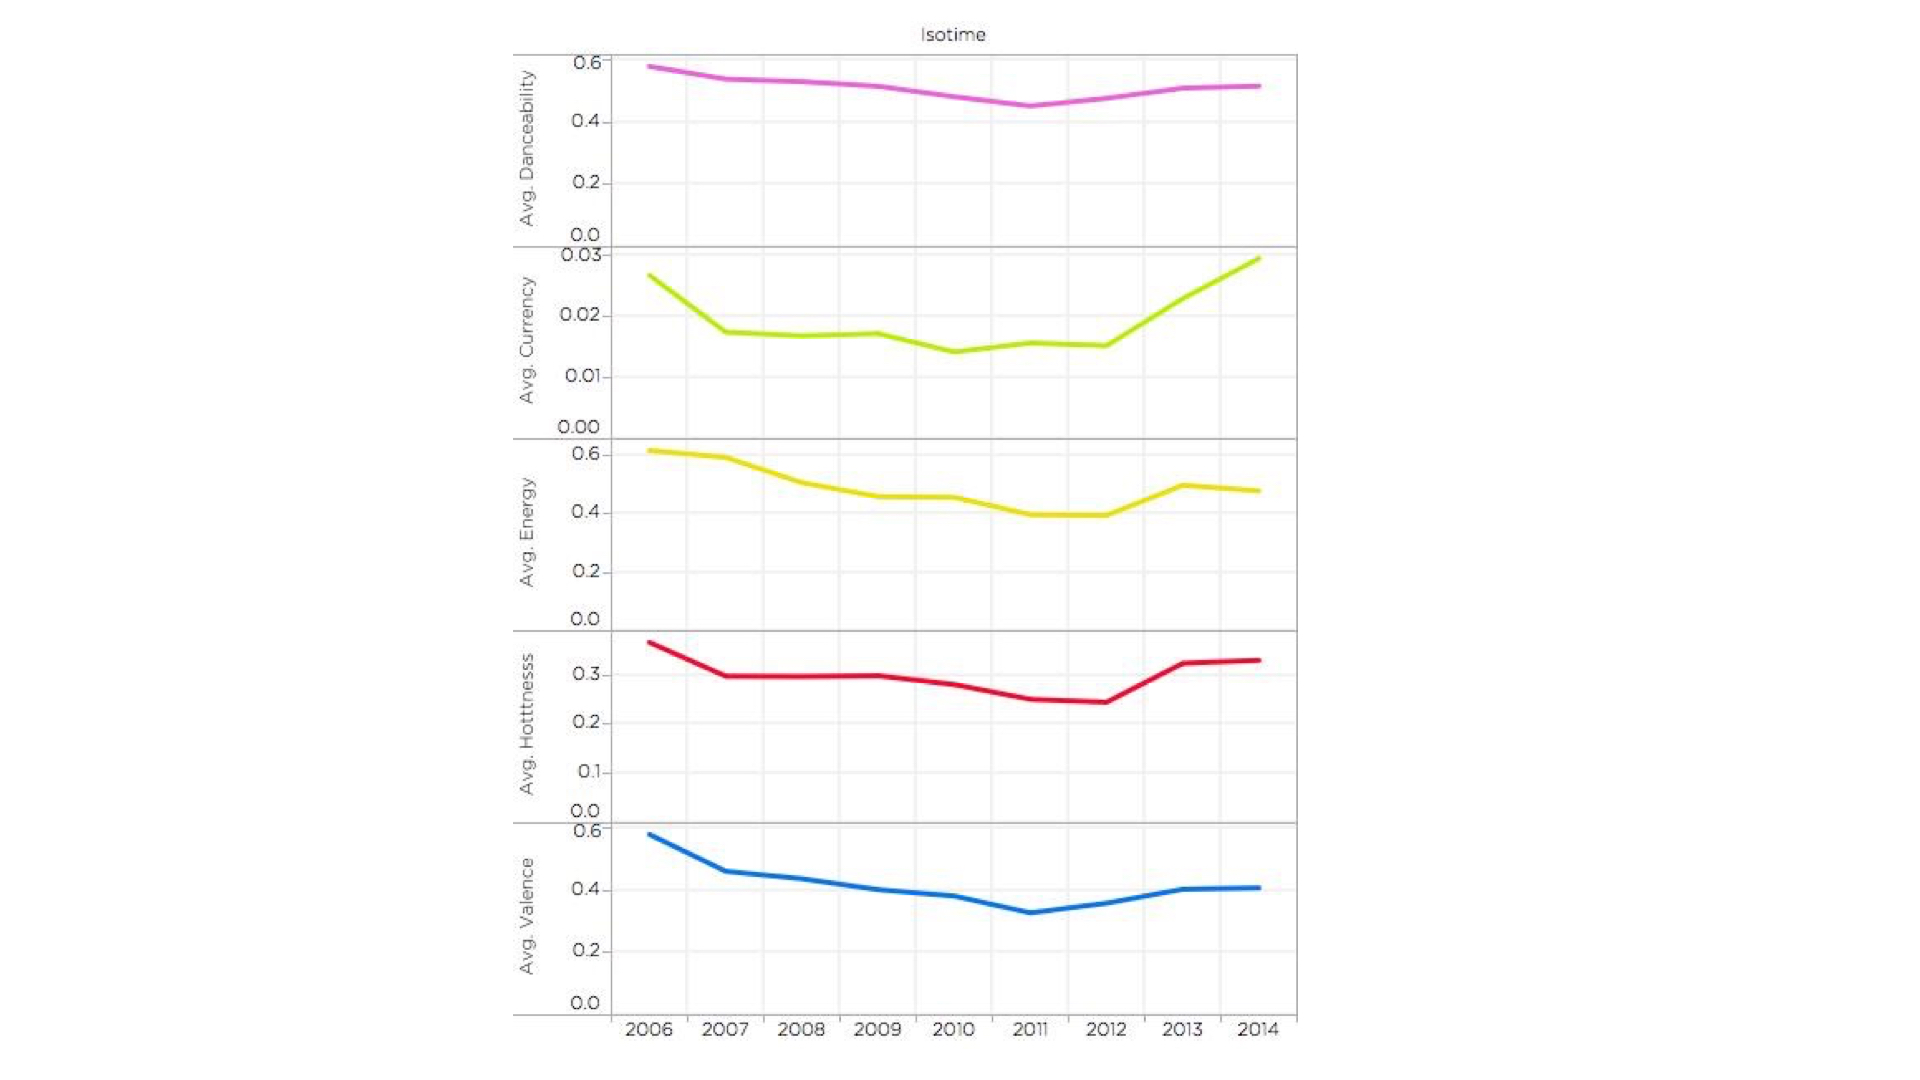
The beauty of a dataset that is inherently a time series is that you can uncover patterns of change over periods of time.
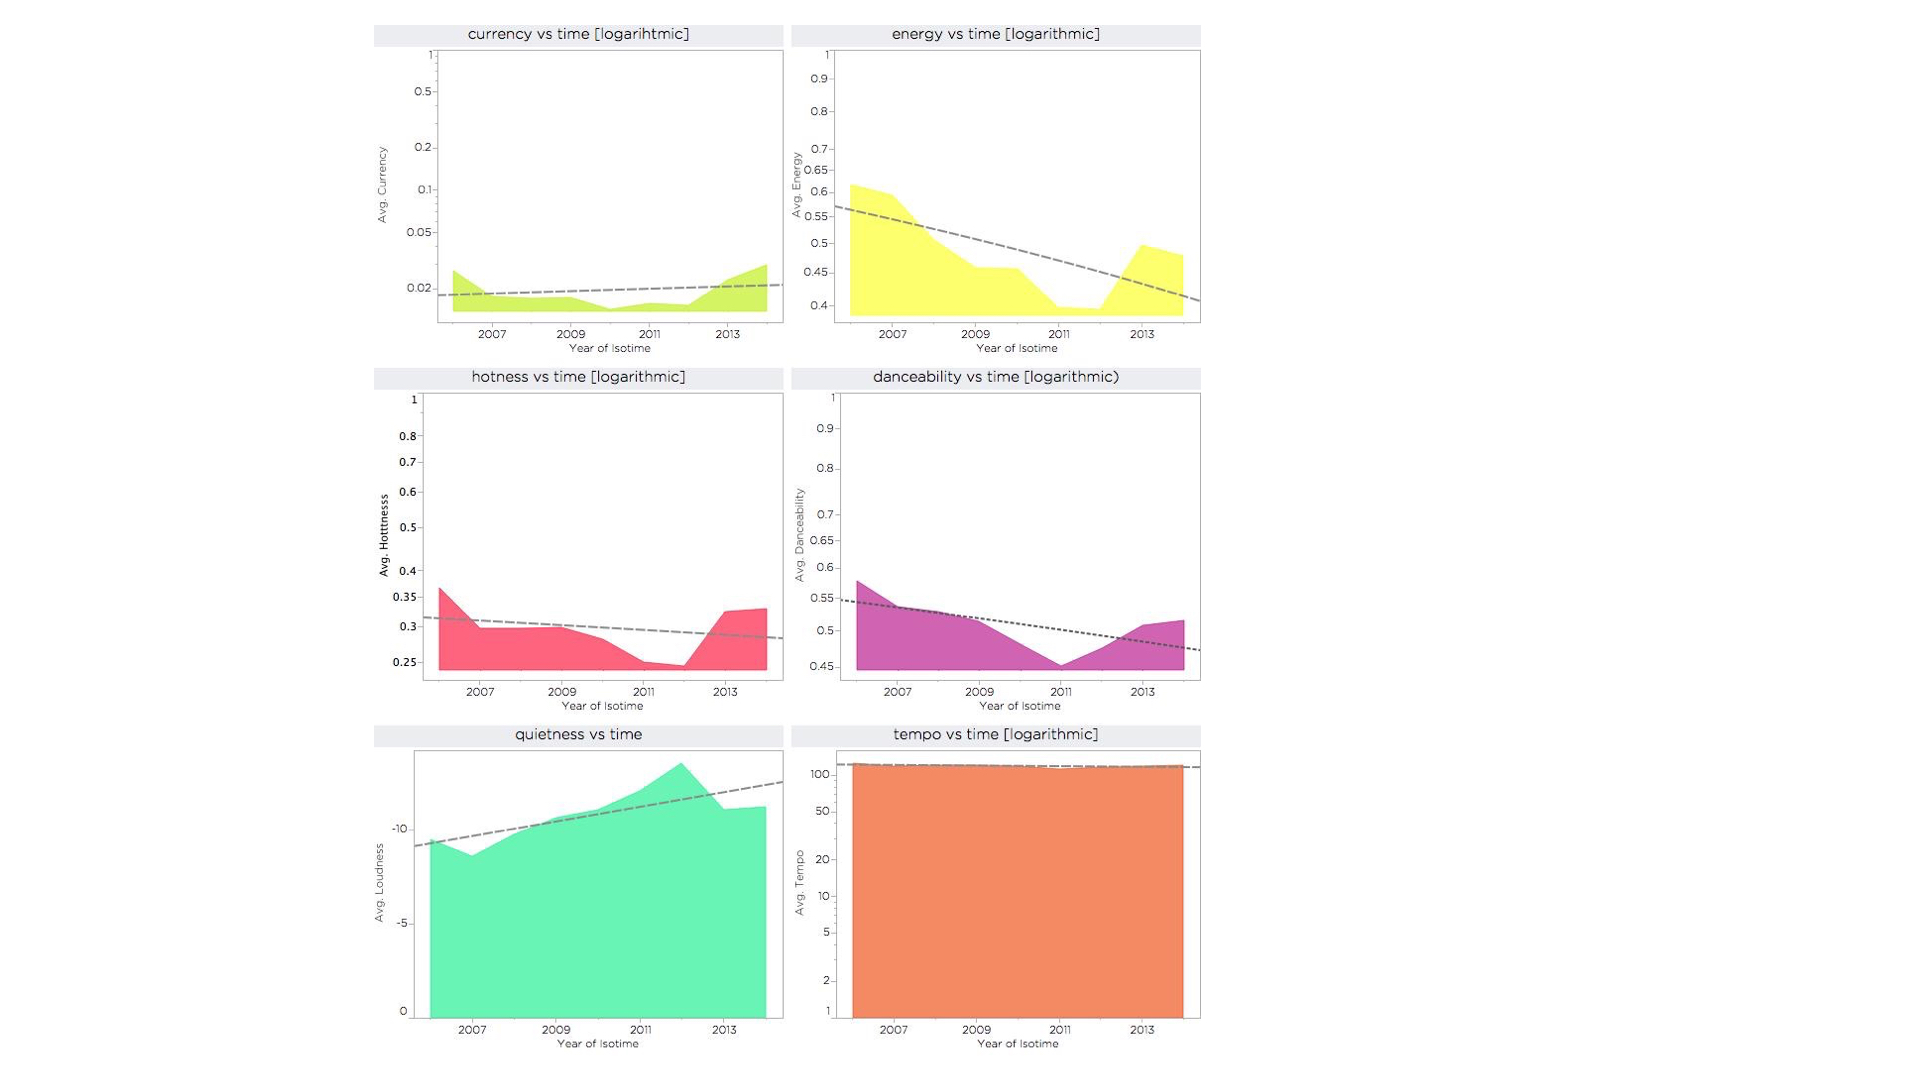
The general pattern of change in my music tastes is towards less danceable, less energetic music as I grow older. (All values calculated in the below graphs are calculated as averages to make up for the uneven volume of listens.)
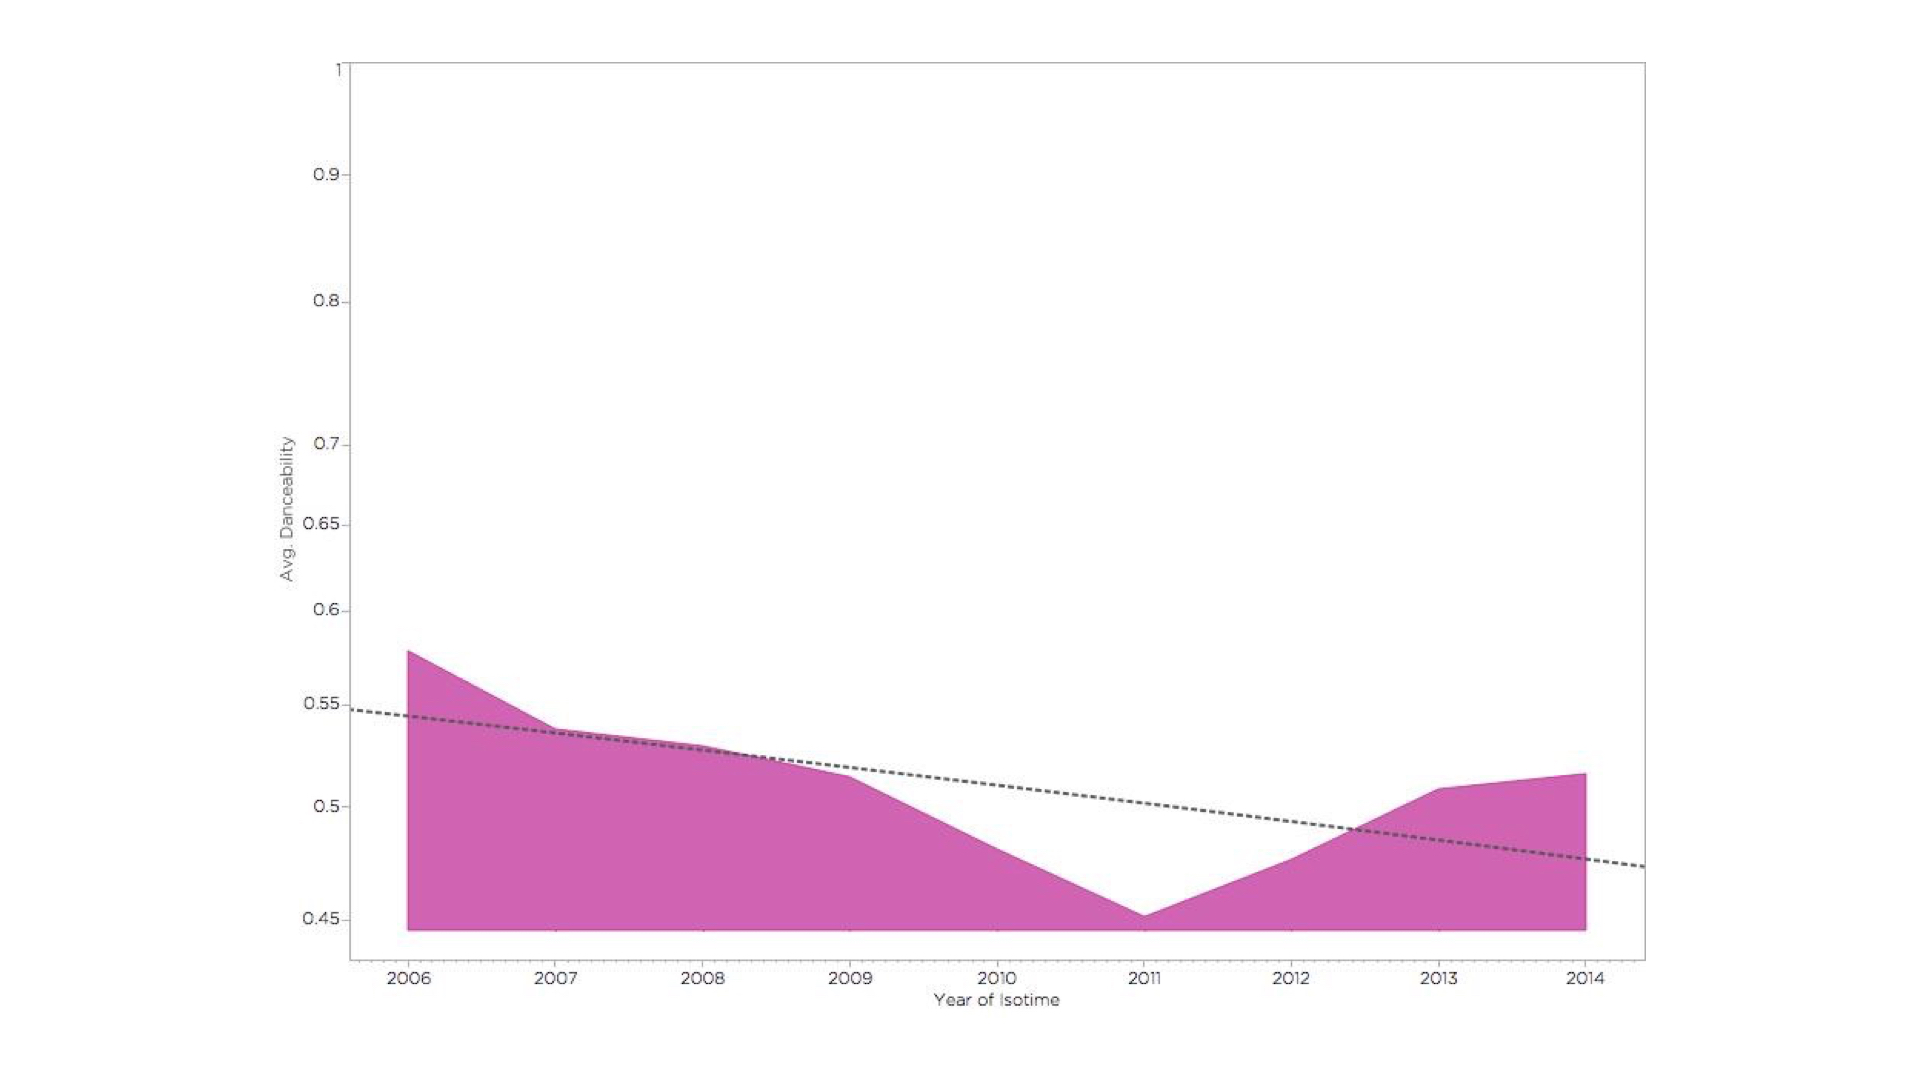

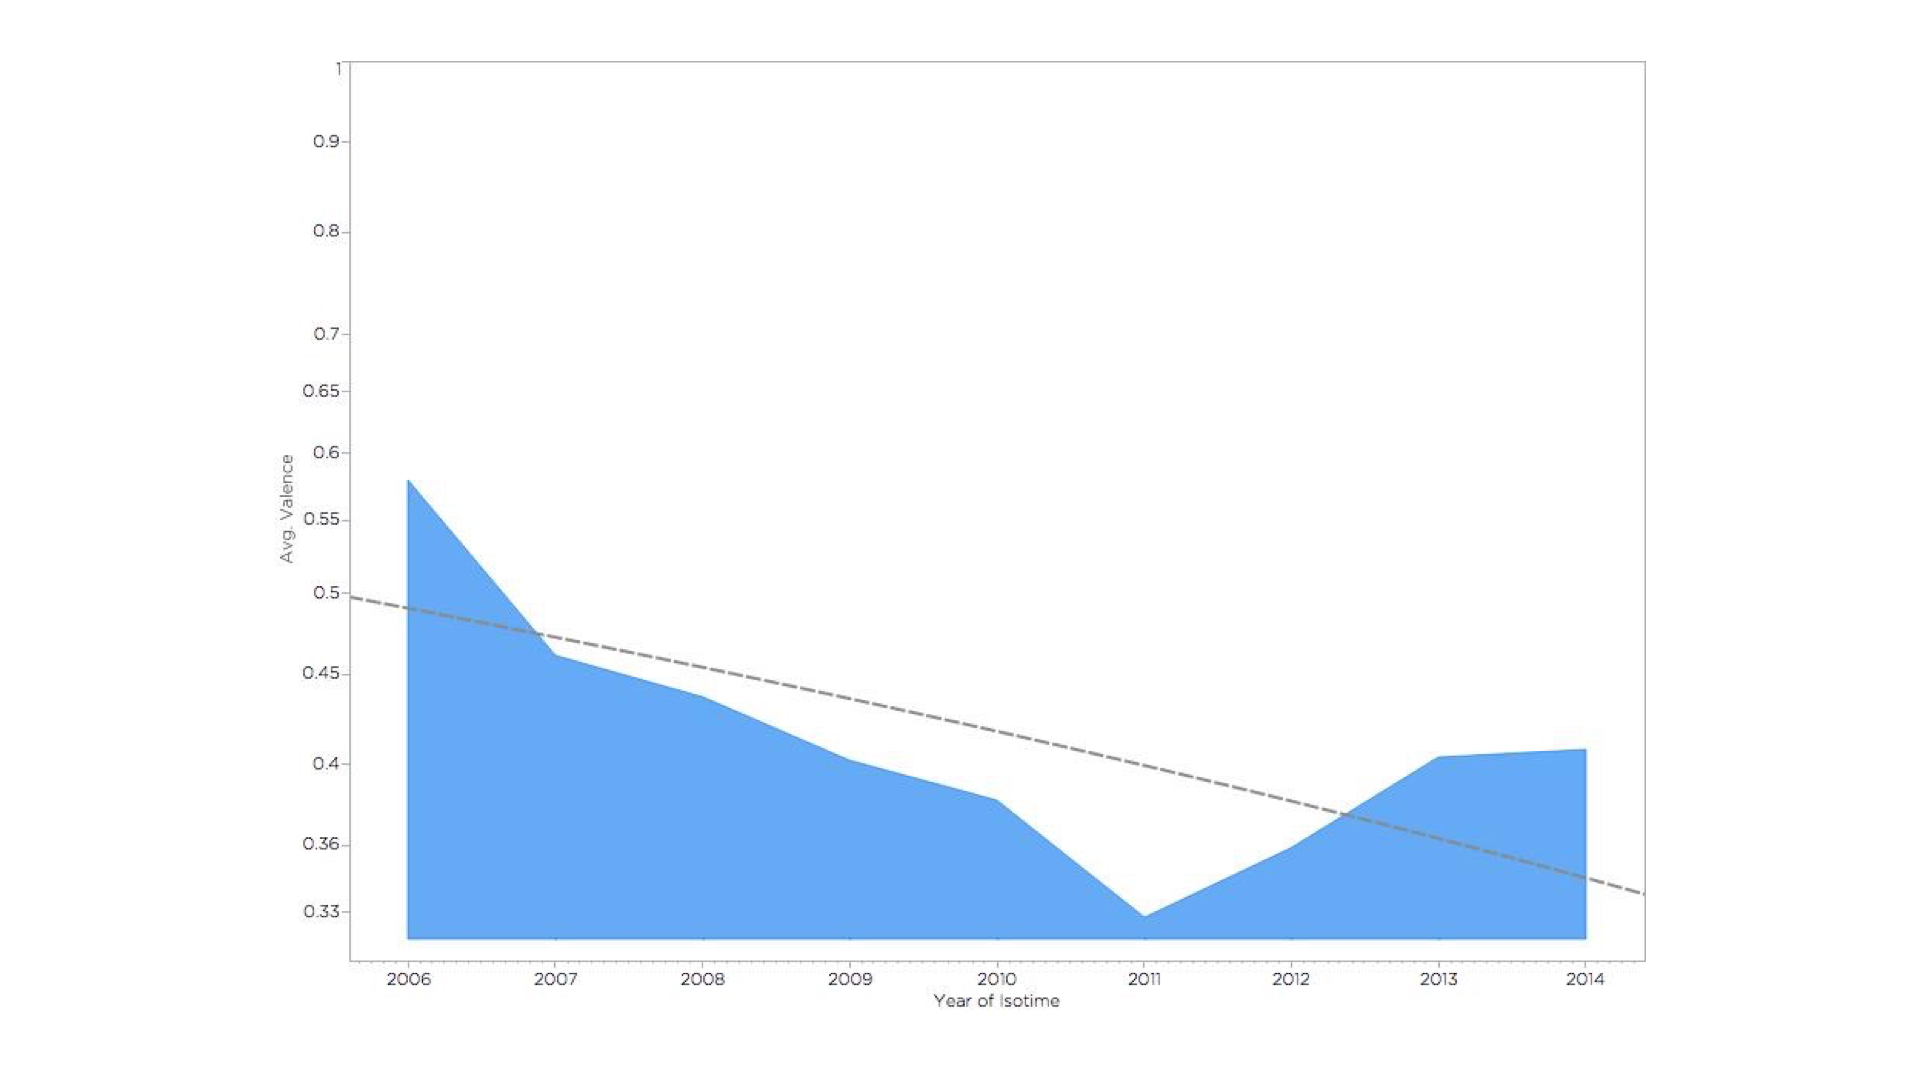
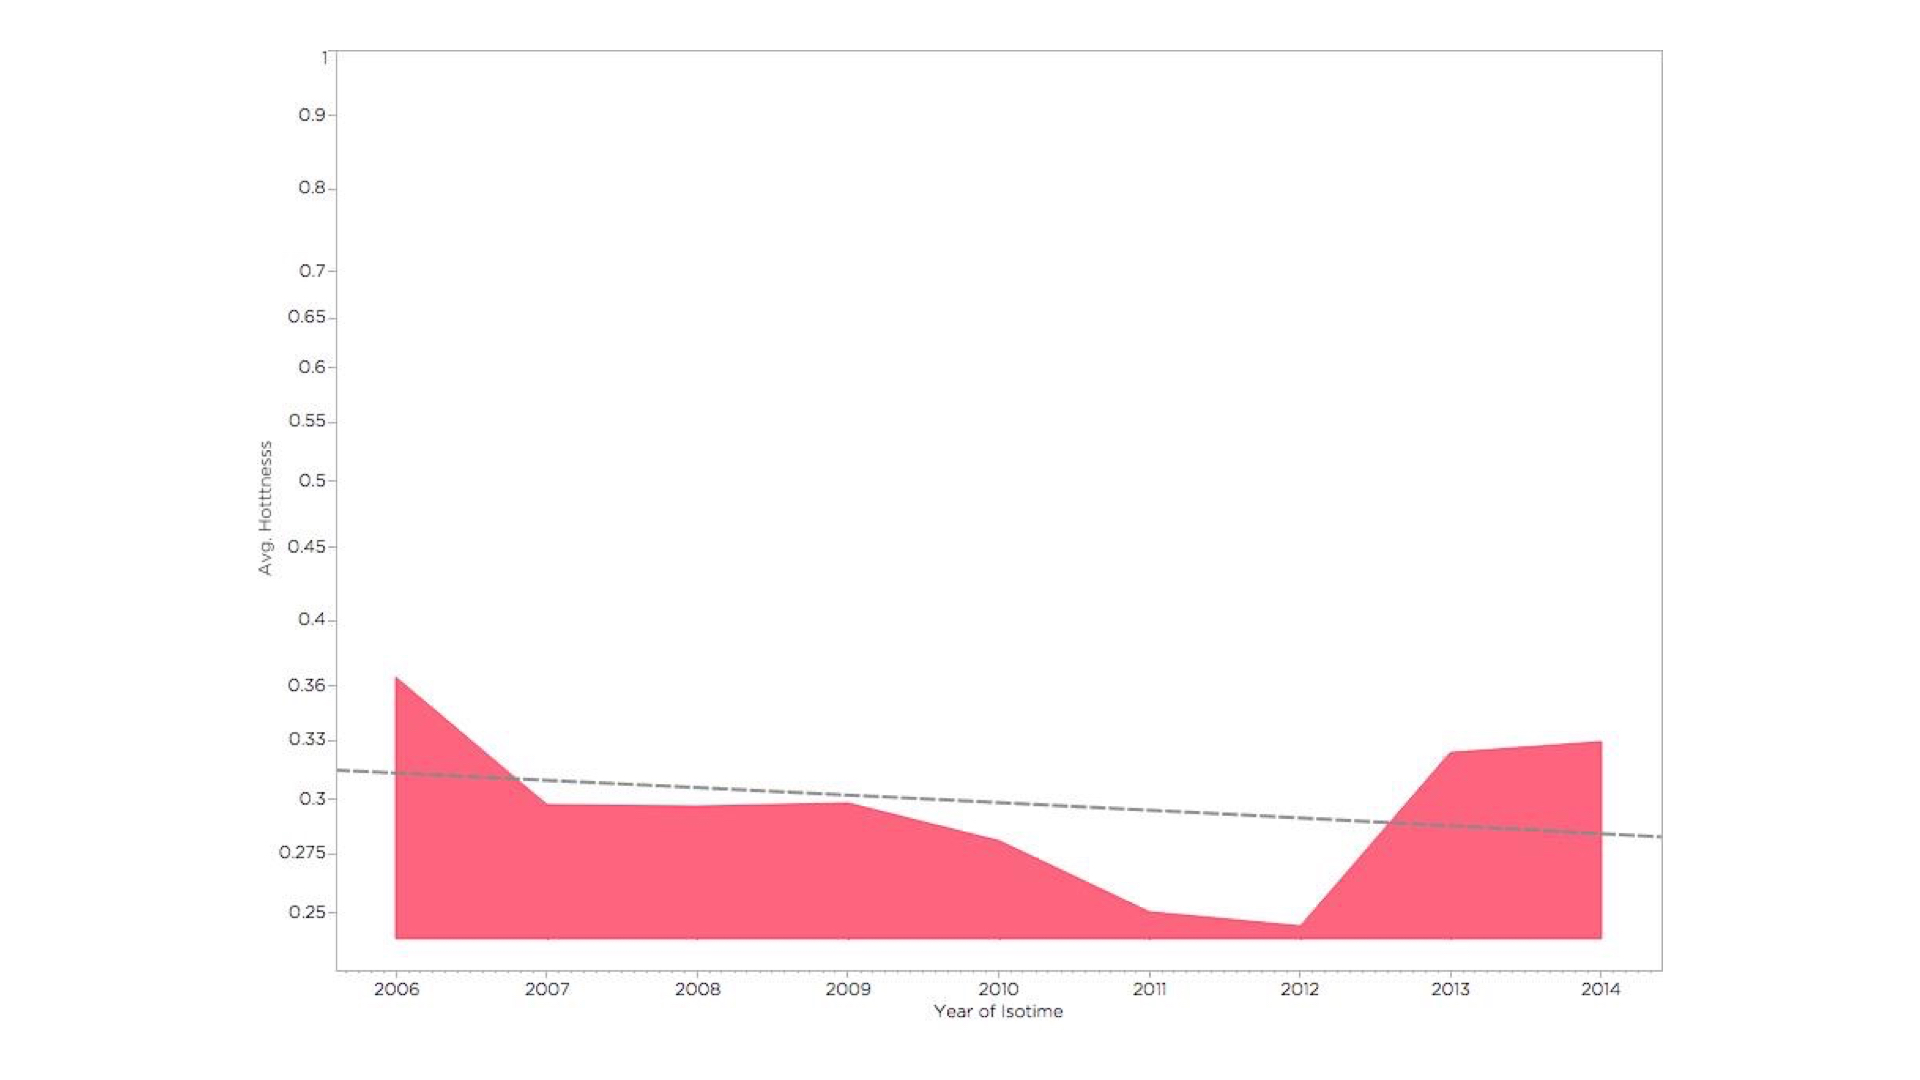
However, there seems to be a consistent dip in most of the upbeatness-related music parameters in 2011-2012. I can only attribute that to a period of depression I was going through back then.
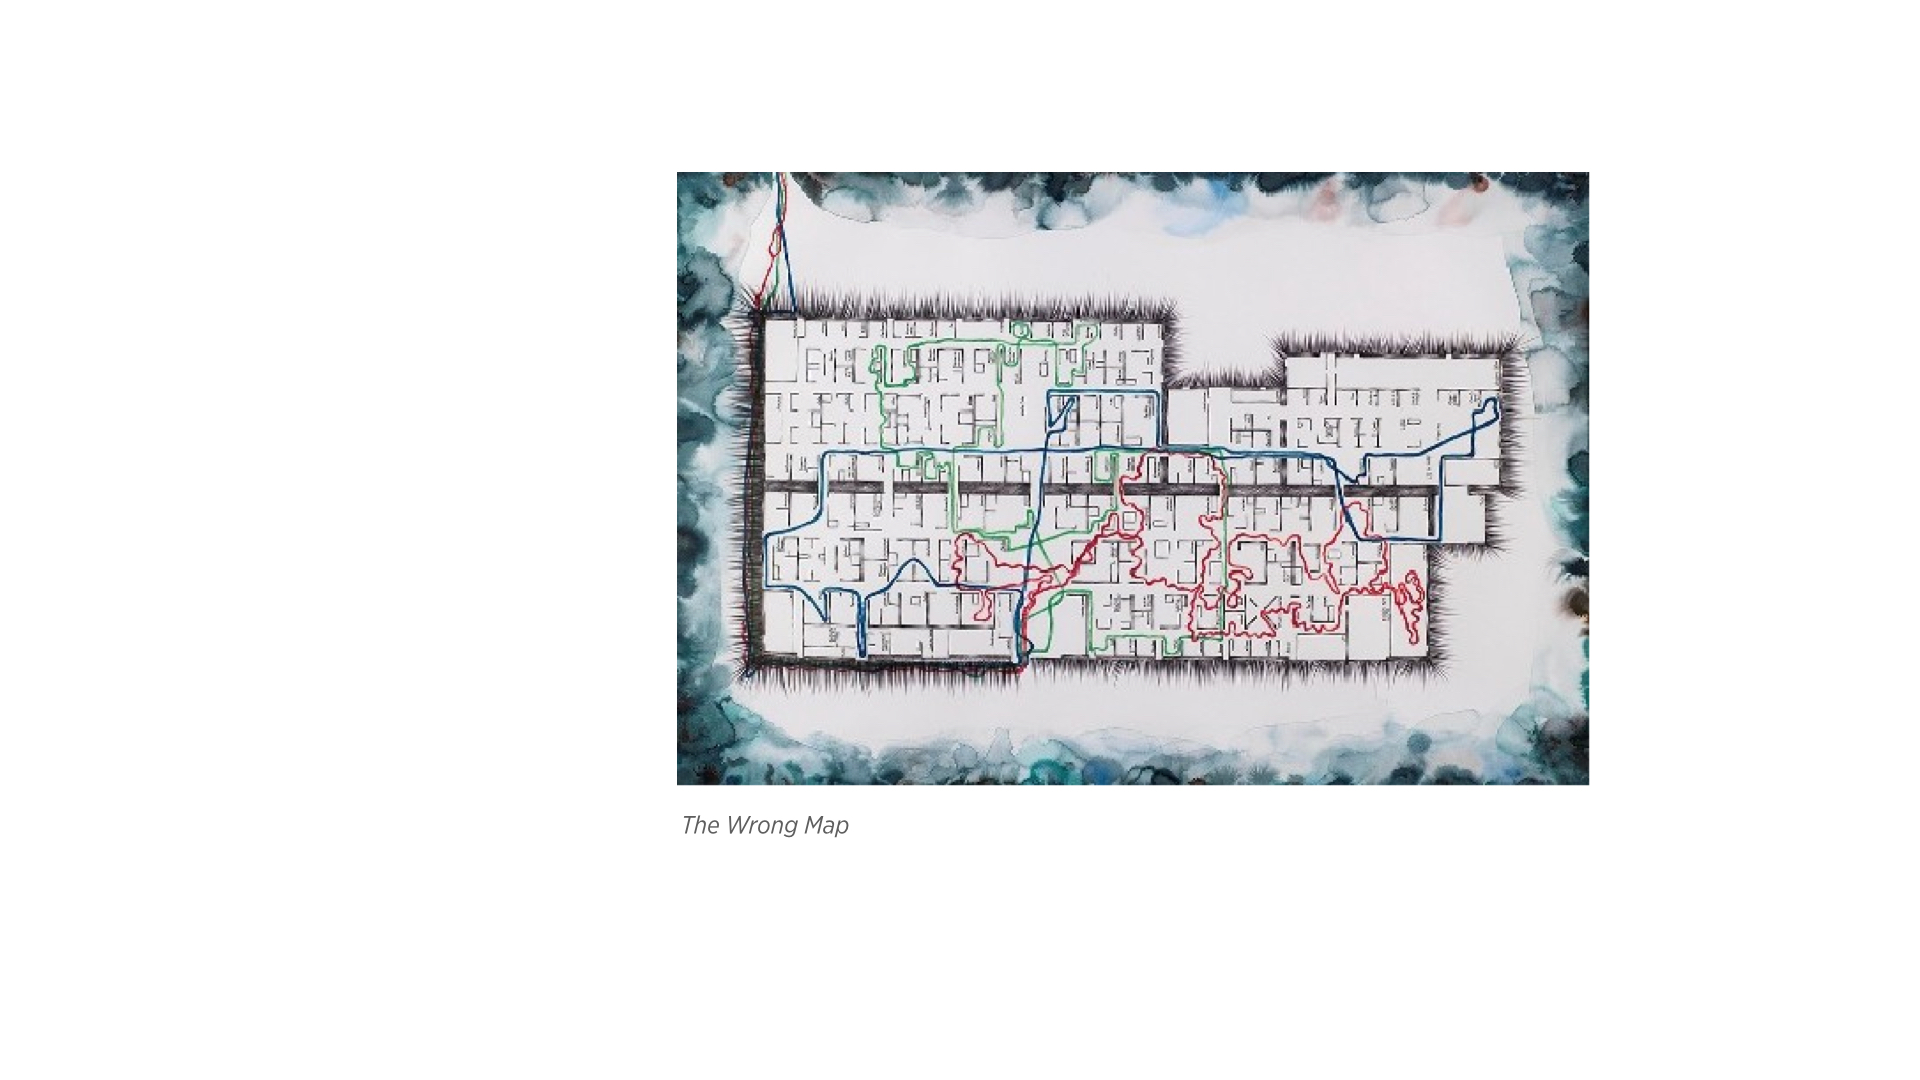
This is a project that came as a result from my research into cartography as a medium for both art and propaganda for my Temporary Expert class.
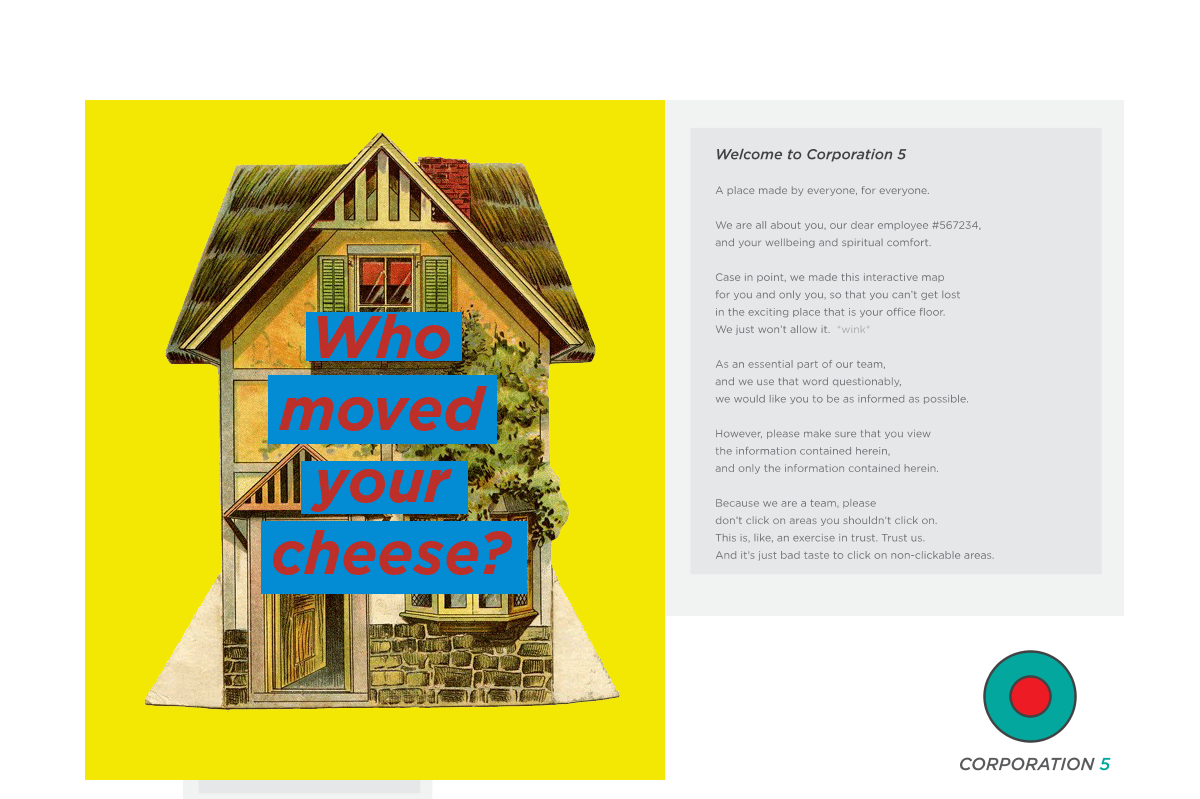
Inspired by all that, I wanted to make a map that has two layers of meaning: one apparent that is mundane and sterile, and another that is hidden and “sinister.”
Propaganda, I feel, has to be about a cause, and the only cause that I am remotely passionate against is the corporate system.
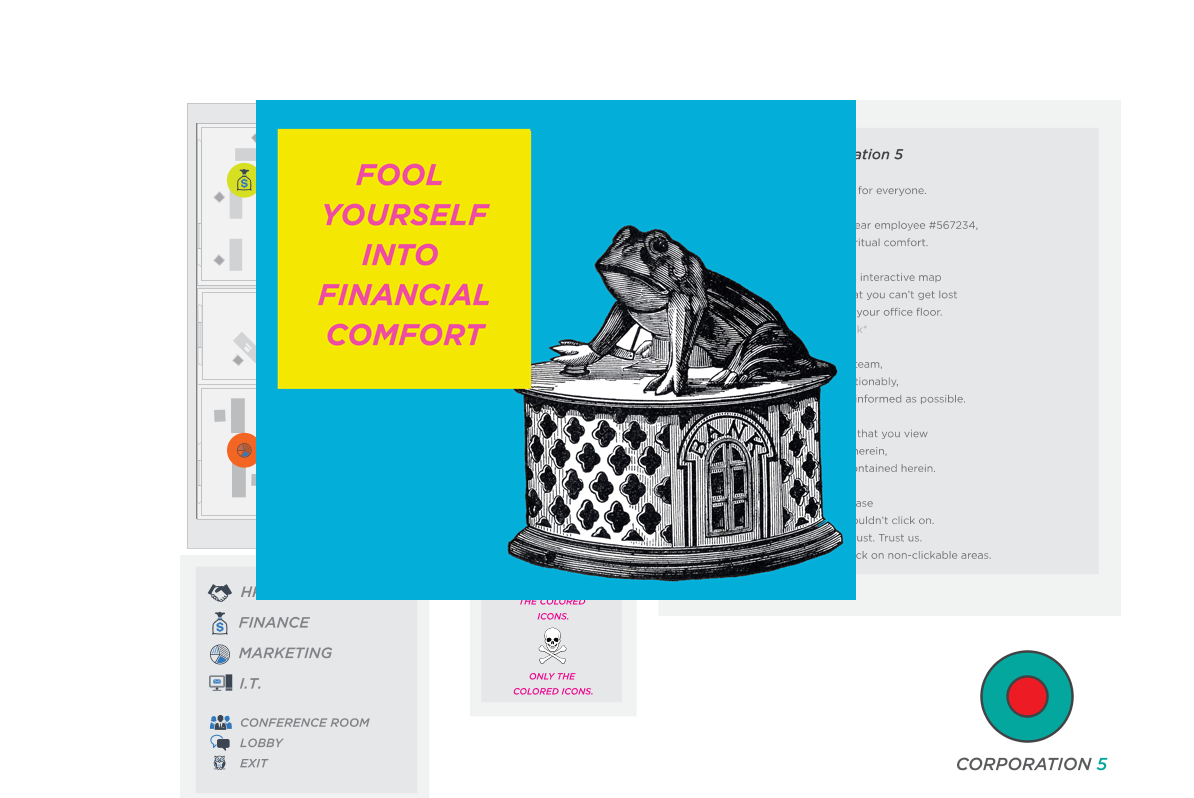
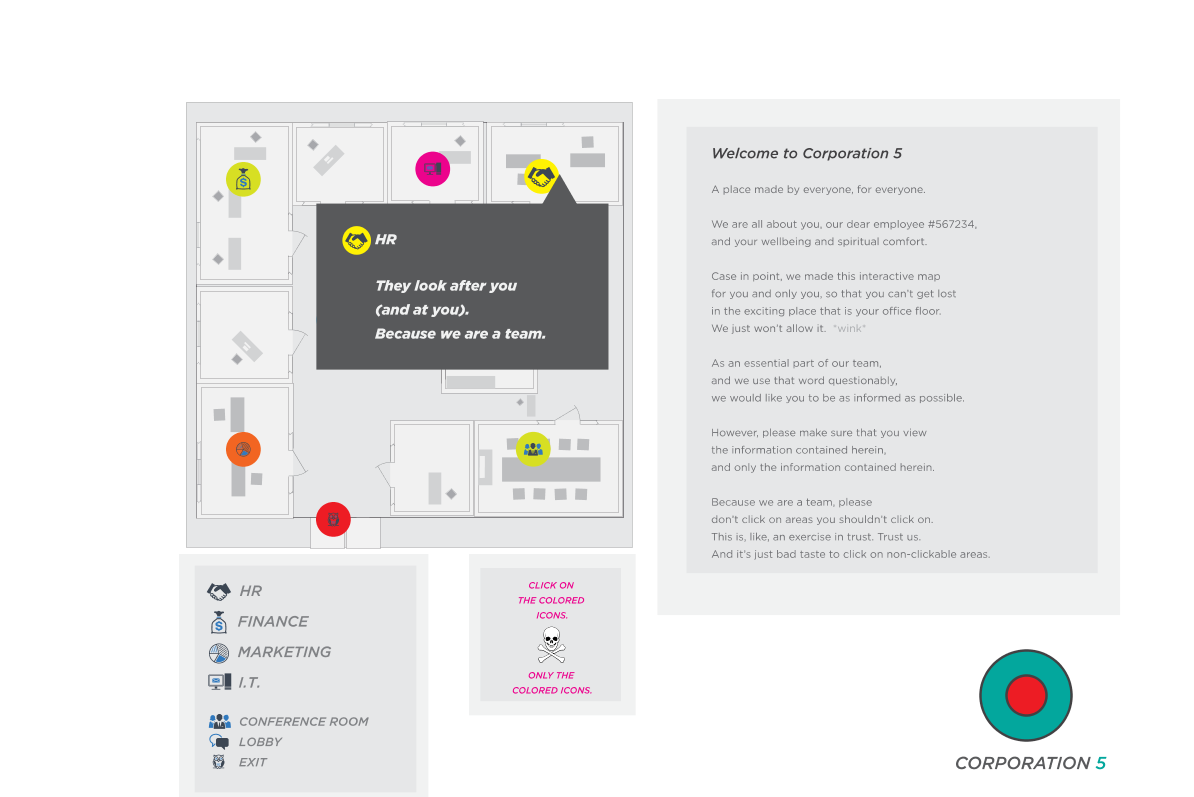
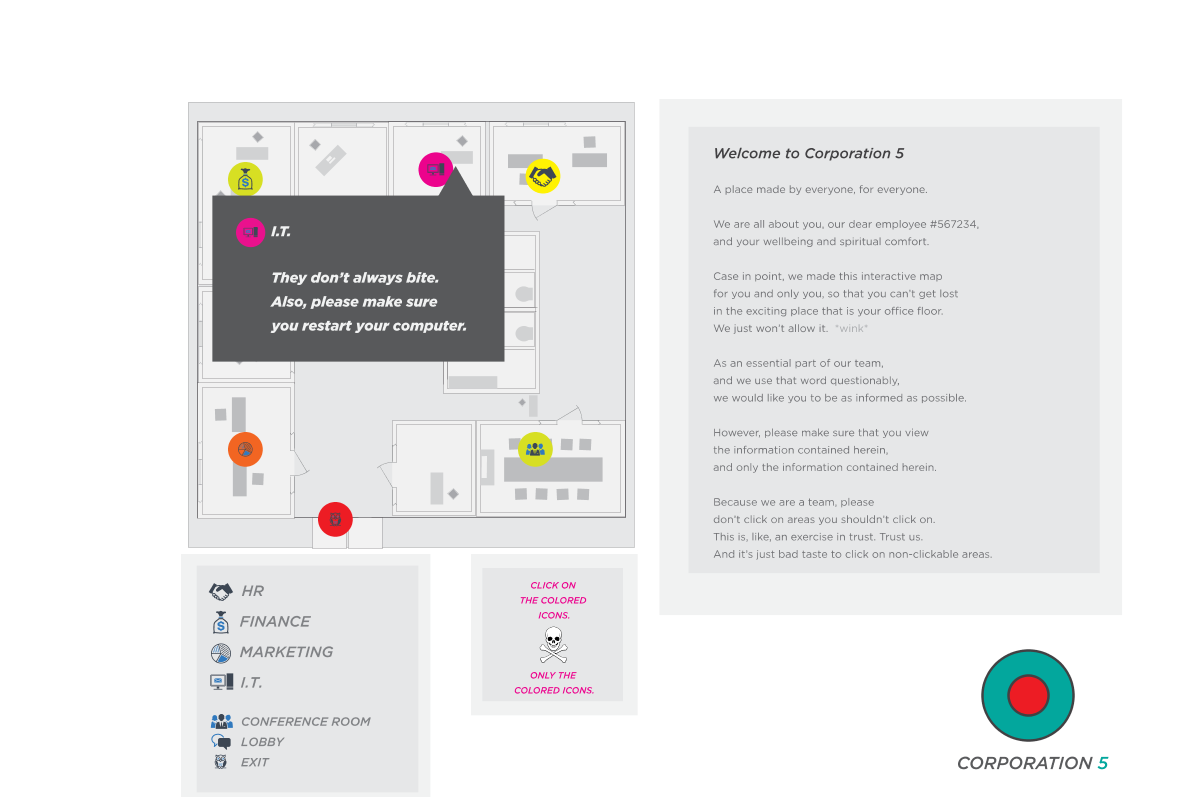
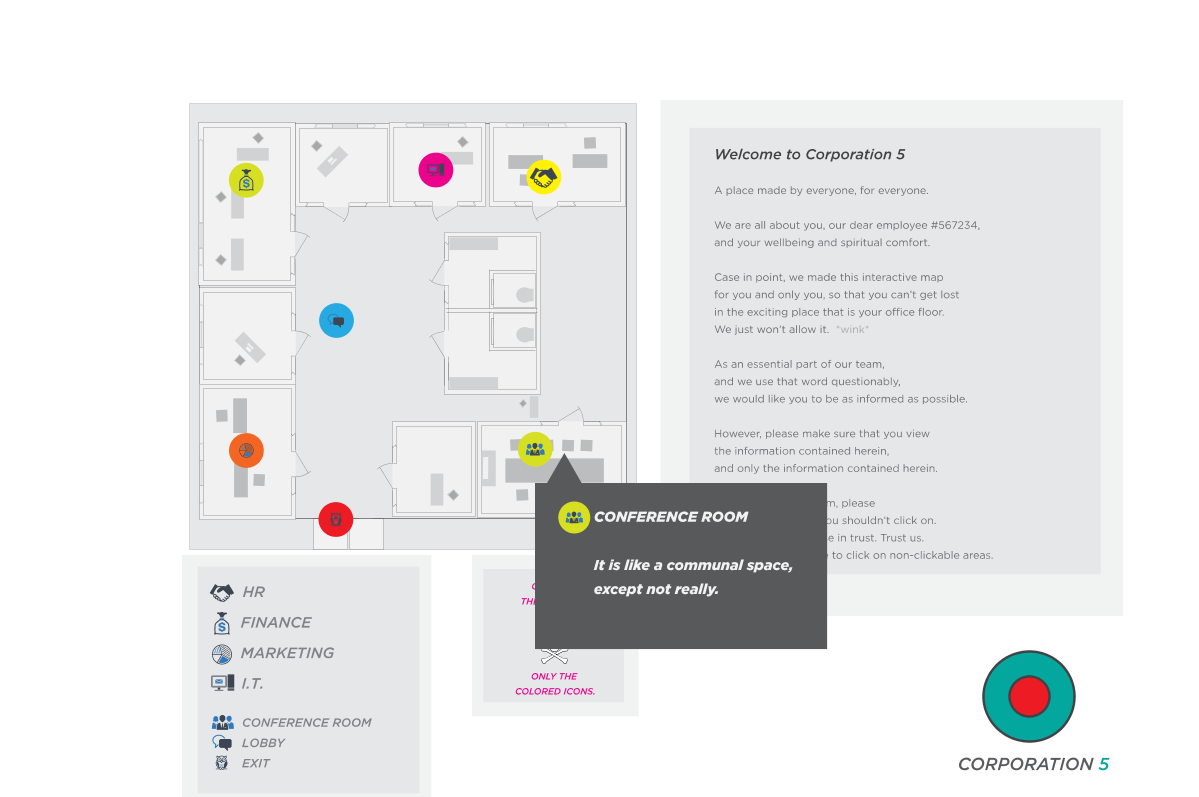
Naturally, I opted to make an interactive map that a fictional corporation has commissioned and placed in one of its floors so that new employees can interactively get familiar with their new habitat.
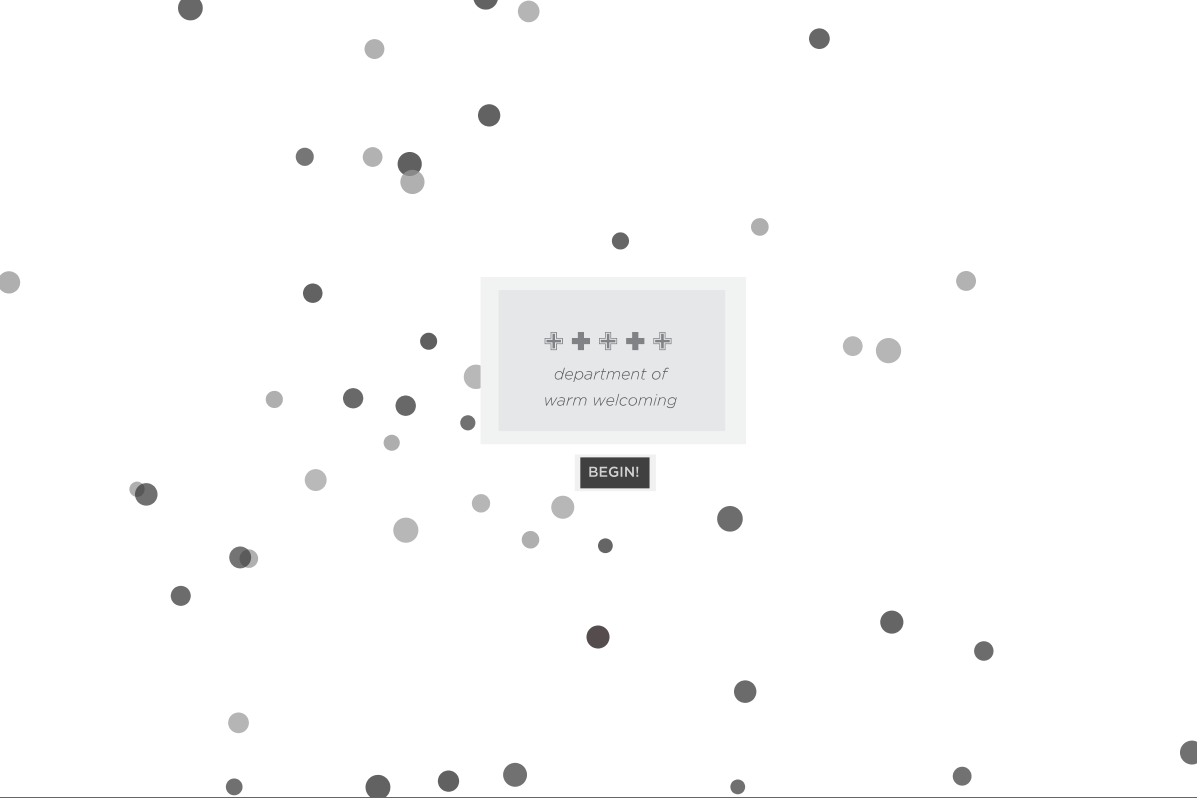
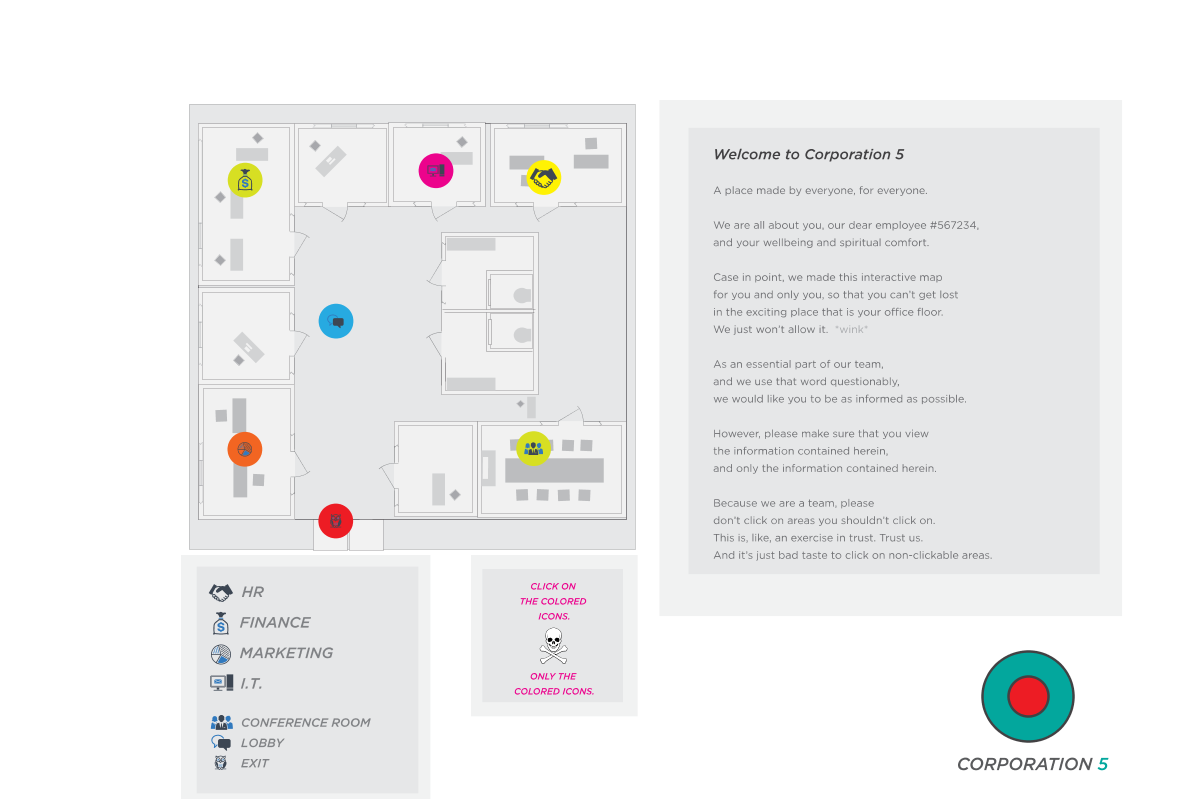
The user is instructed to click on and only on the colored icons. Upon doing that, labels about the different departments in the floor are displayed.
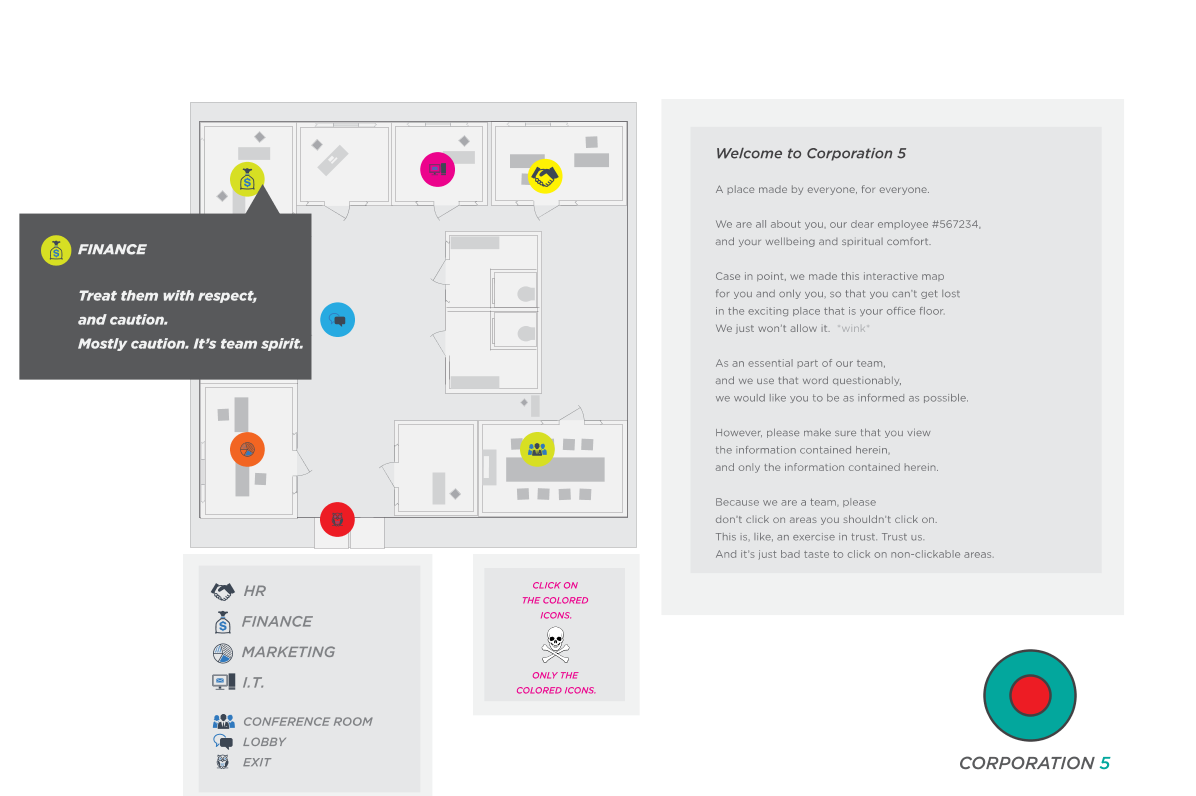
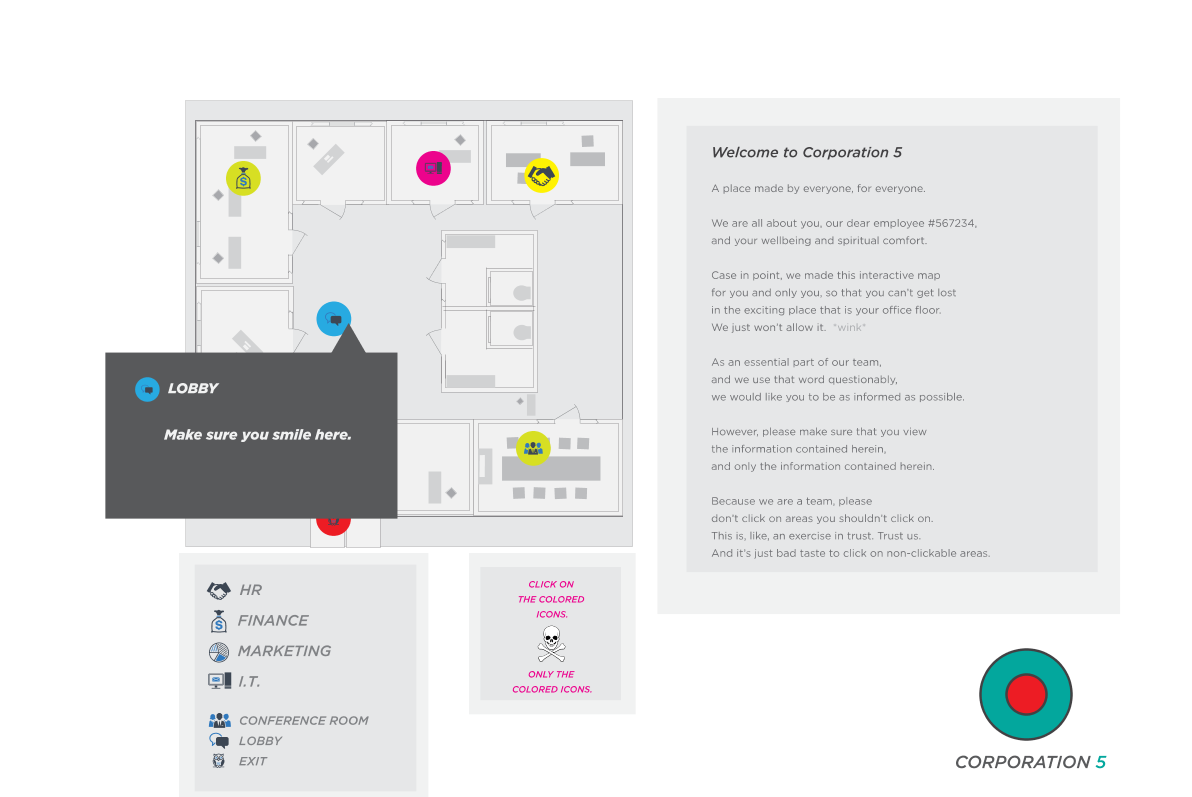
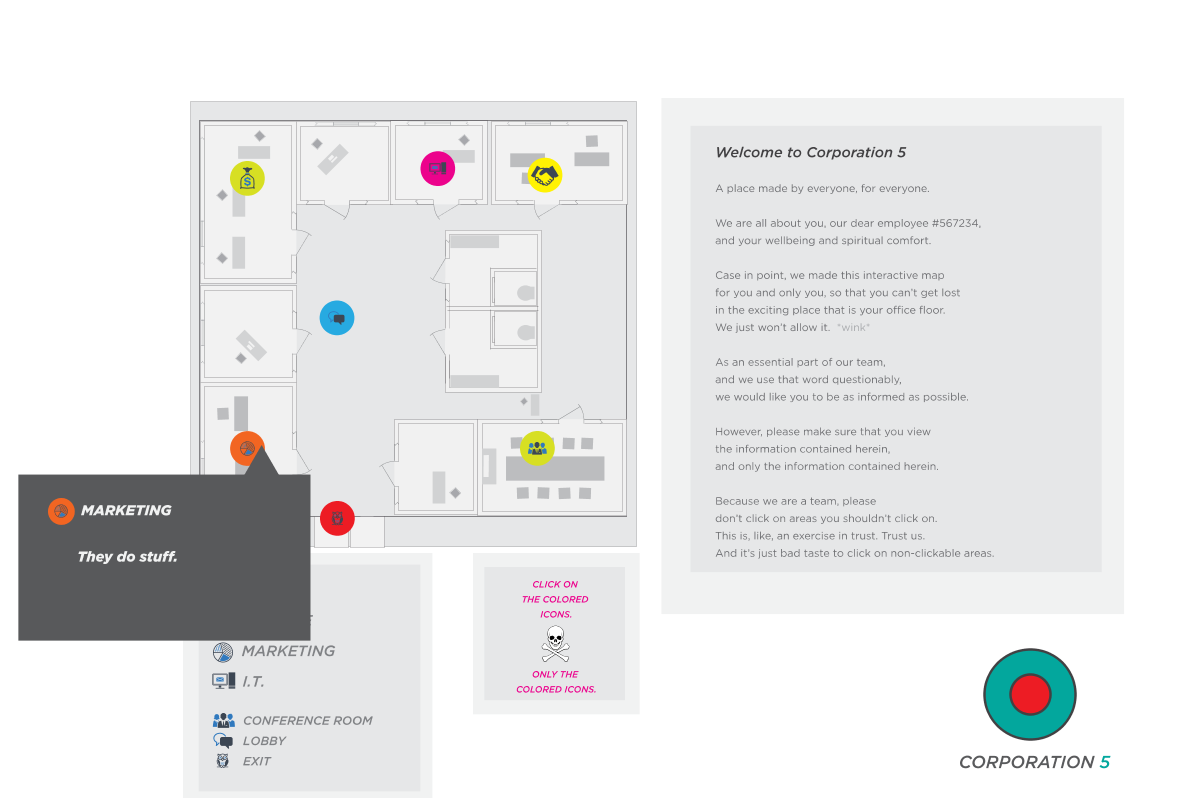
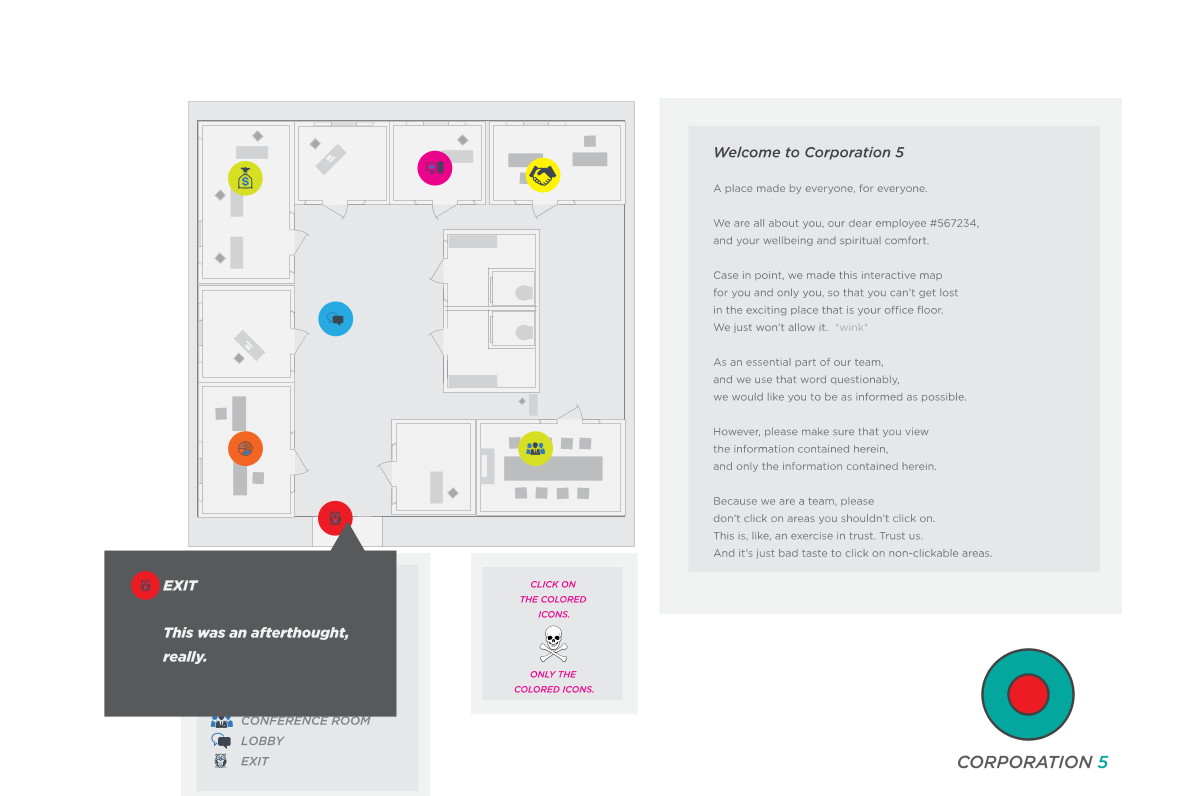
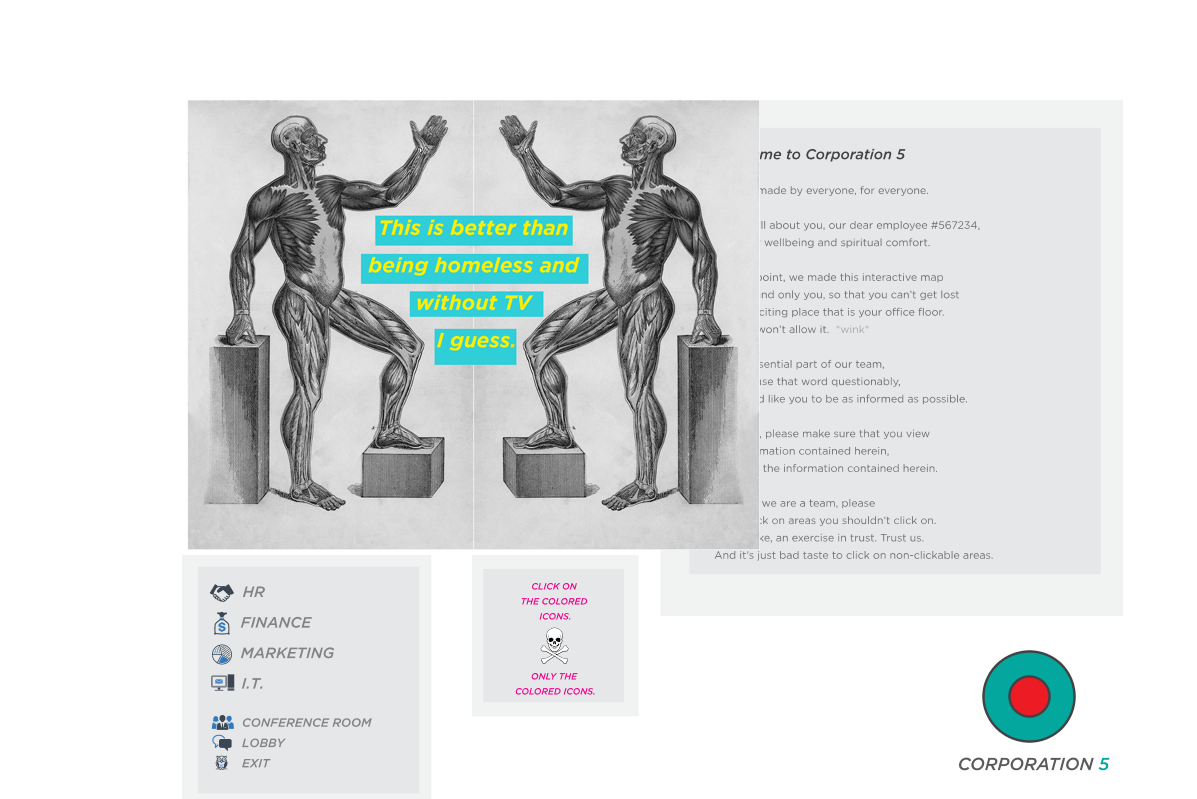
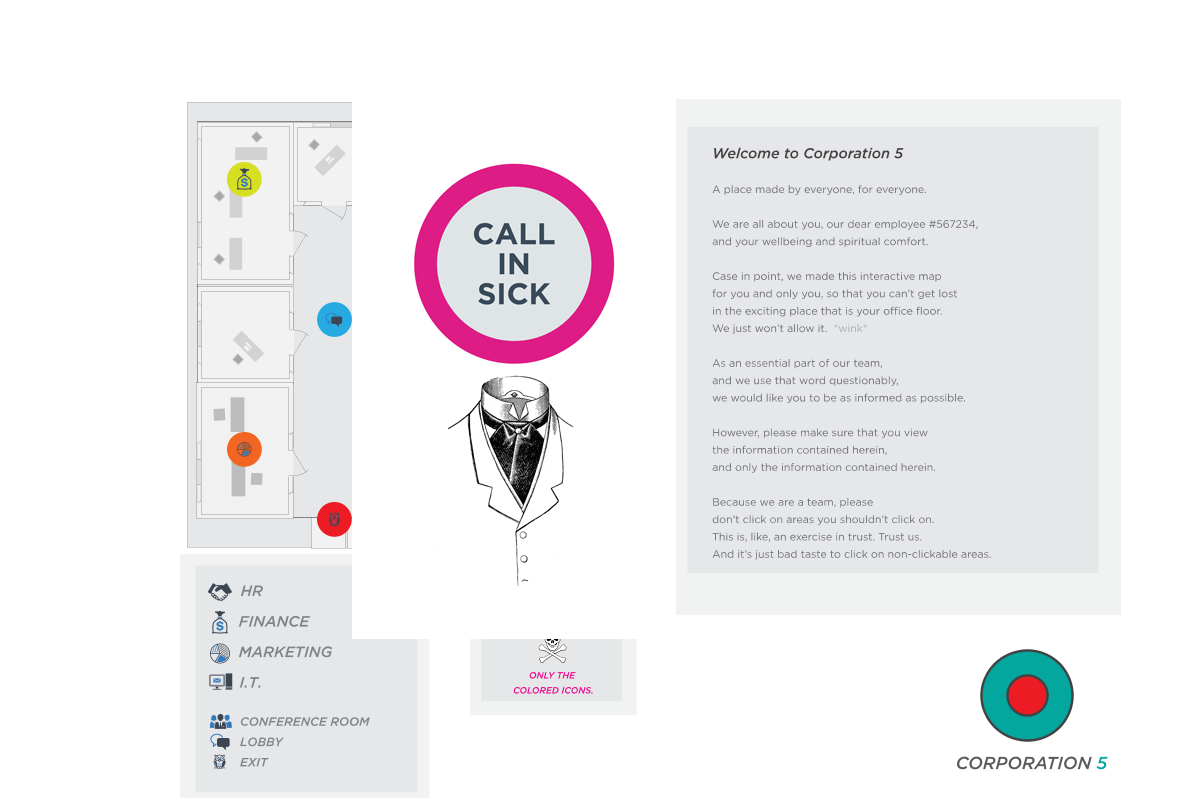
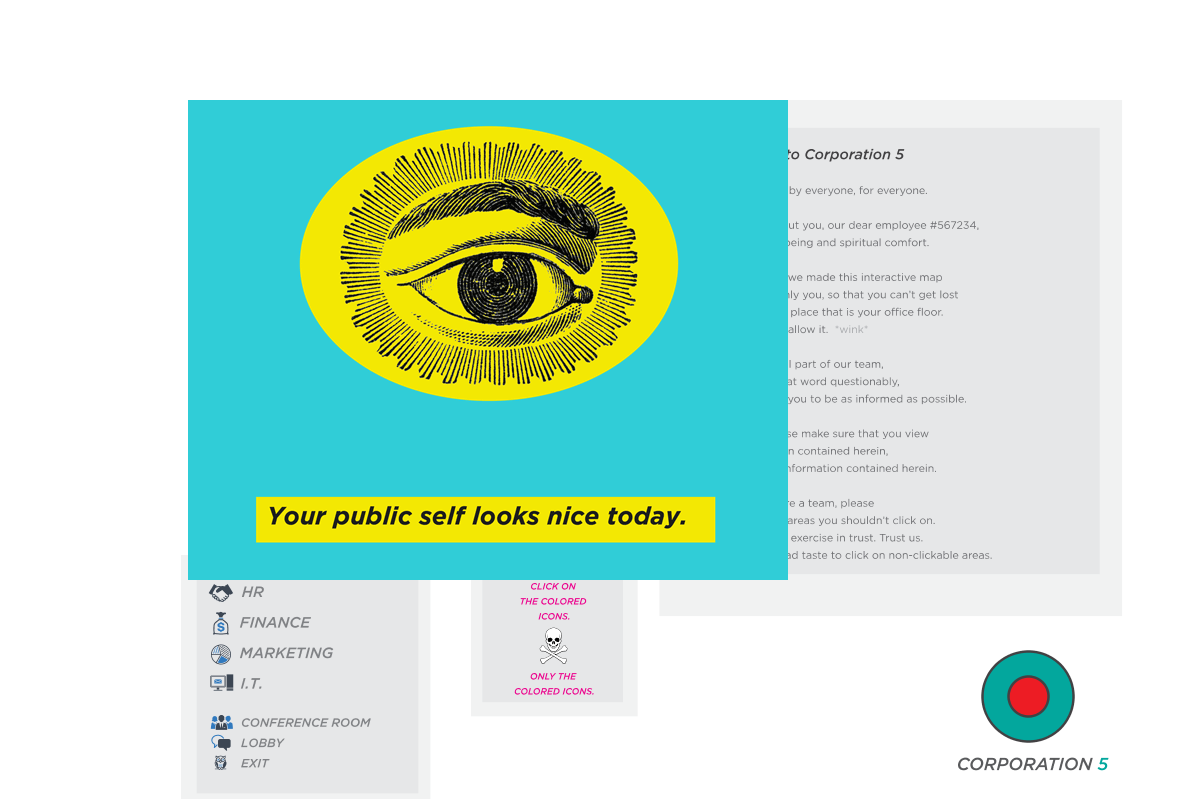
To me, the language of propaganda is the language of slogans. Its most natural medium is the medium of graphic posters.
When the user “defies” the obvious instructions by clicking on other, non-highlighted elements on the map, including some of the desks, the conference room’s screen, and the rest rooms, posters are displayed with anti-corporate messages.
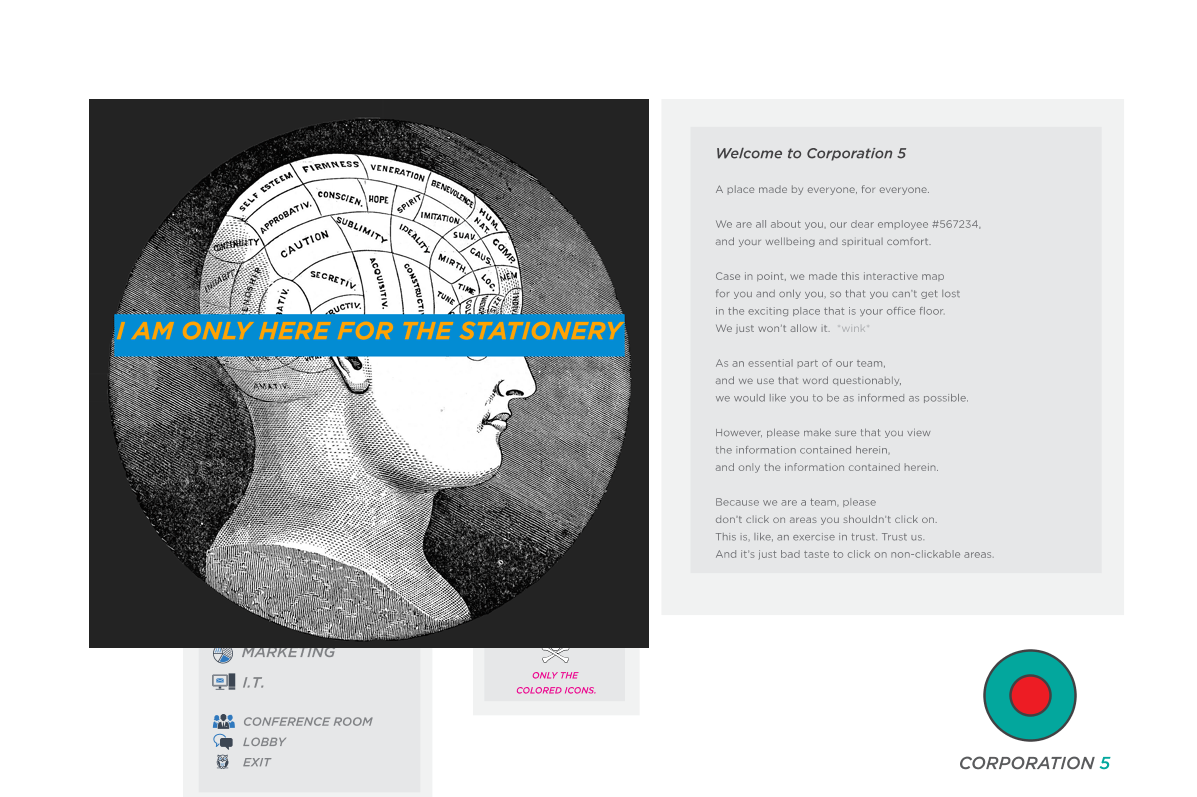
I opted to have an eerie piano music piece to accompany the map, and also make the animation of the pieces floaty and slow to communicate a mood of unease.
This is a summary of my final Temporary Expert research project on maps, propaganda, and cartographic art.
Not really, but rather, our perception of maps is. Maps are not completely representational, and were never meant to be. They are, by design, incapable to be that: immersion is not part of their design goals. They don’t represent reality but are used to communicate usable aspects of it.
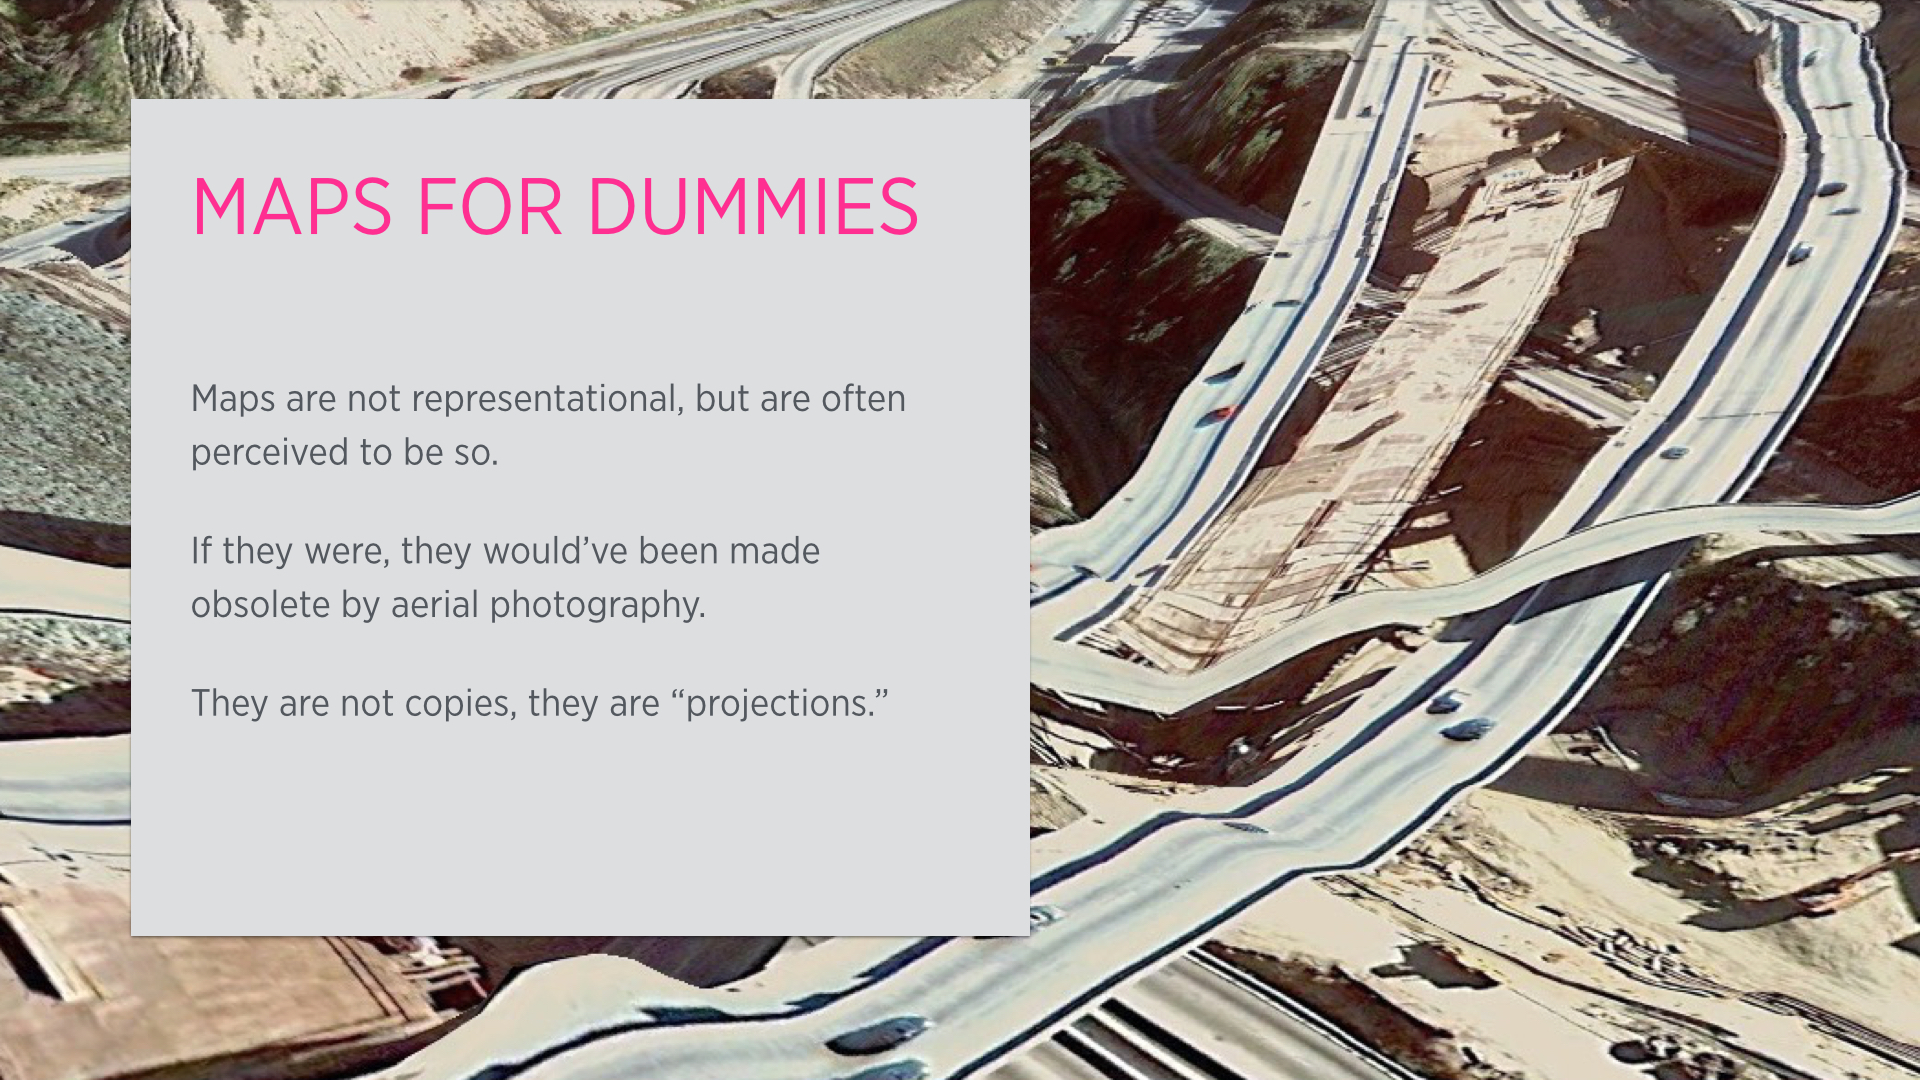
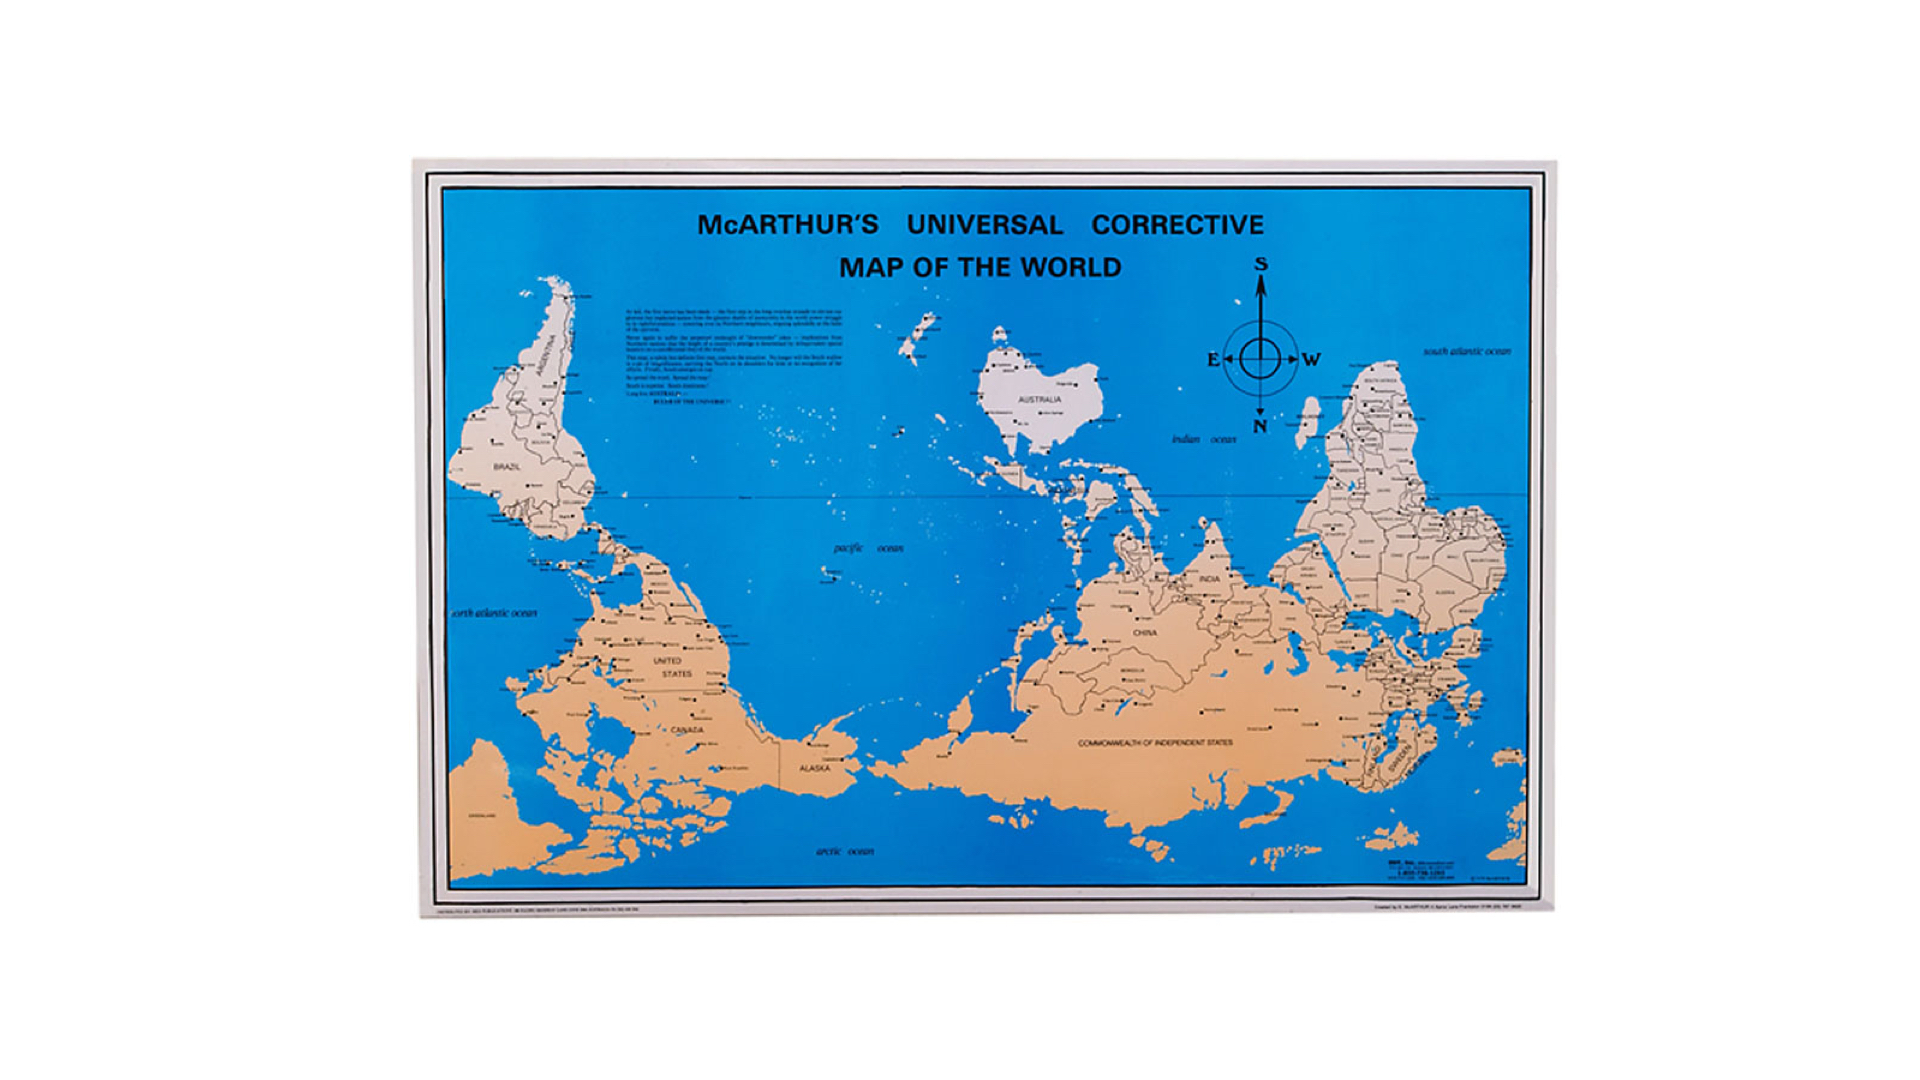
One of the main things about maps is that they are essentially projections, in both senses of the words. A perfect projection does not exist, and the choice of a particular projection depends on what sort of information the map maker feels is most important for the context.
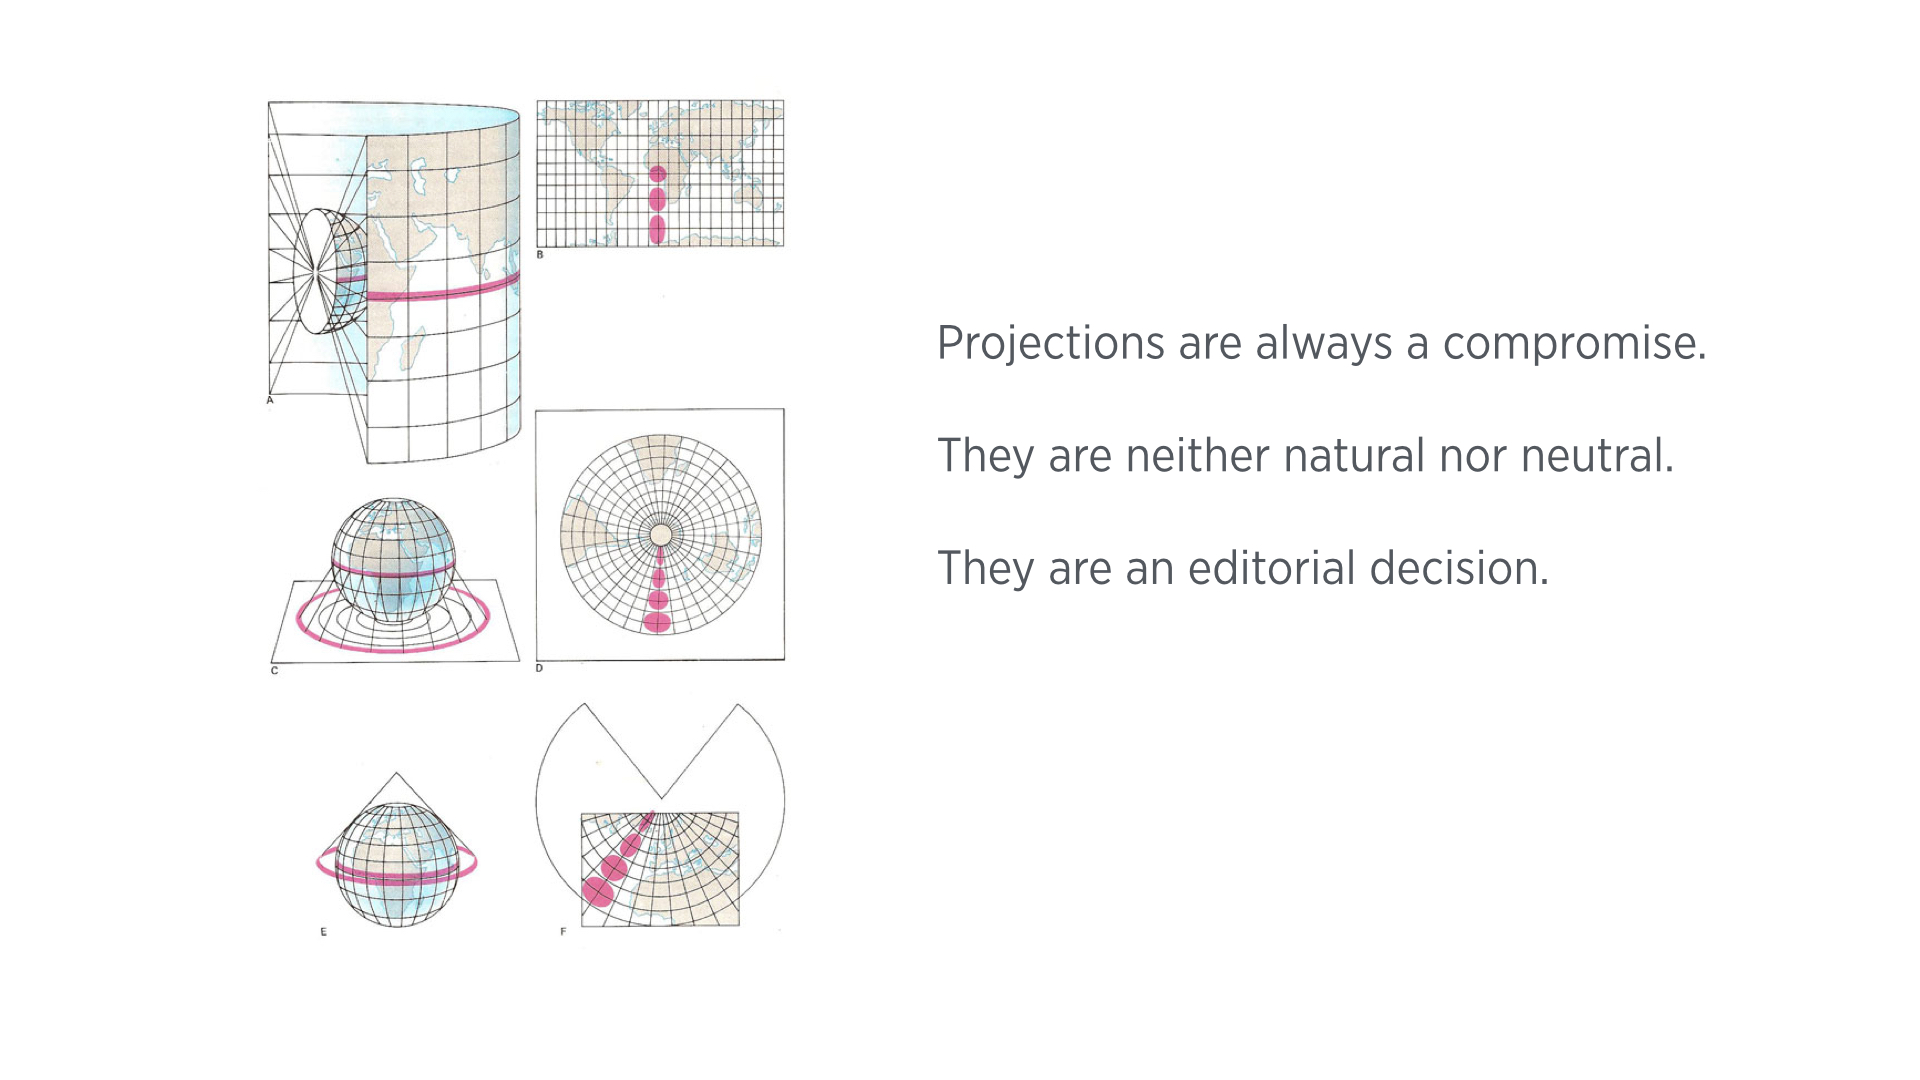
For instance, the Mercator projection (uppermost diagram in the slide above), which is an equatorial, cylindrical projection, is accurate at the equator and gets distorted as you move towards the poles. Other projections can solve that at the expense of other information: Transverse Mercator is more accurate at the poles but completely removes a geographical point at the equator. There are also azimuthal and conic projections, like the ones illustrated in the middle and bottom of the slide above. While they are accurate at the polar areas, they distort all other areas, and/or introduce discontinuities to the topography. 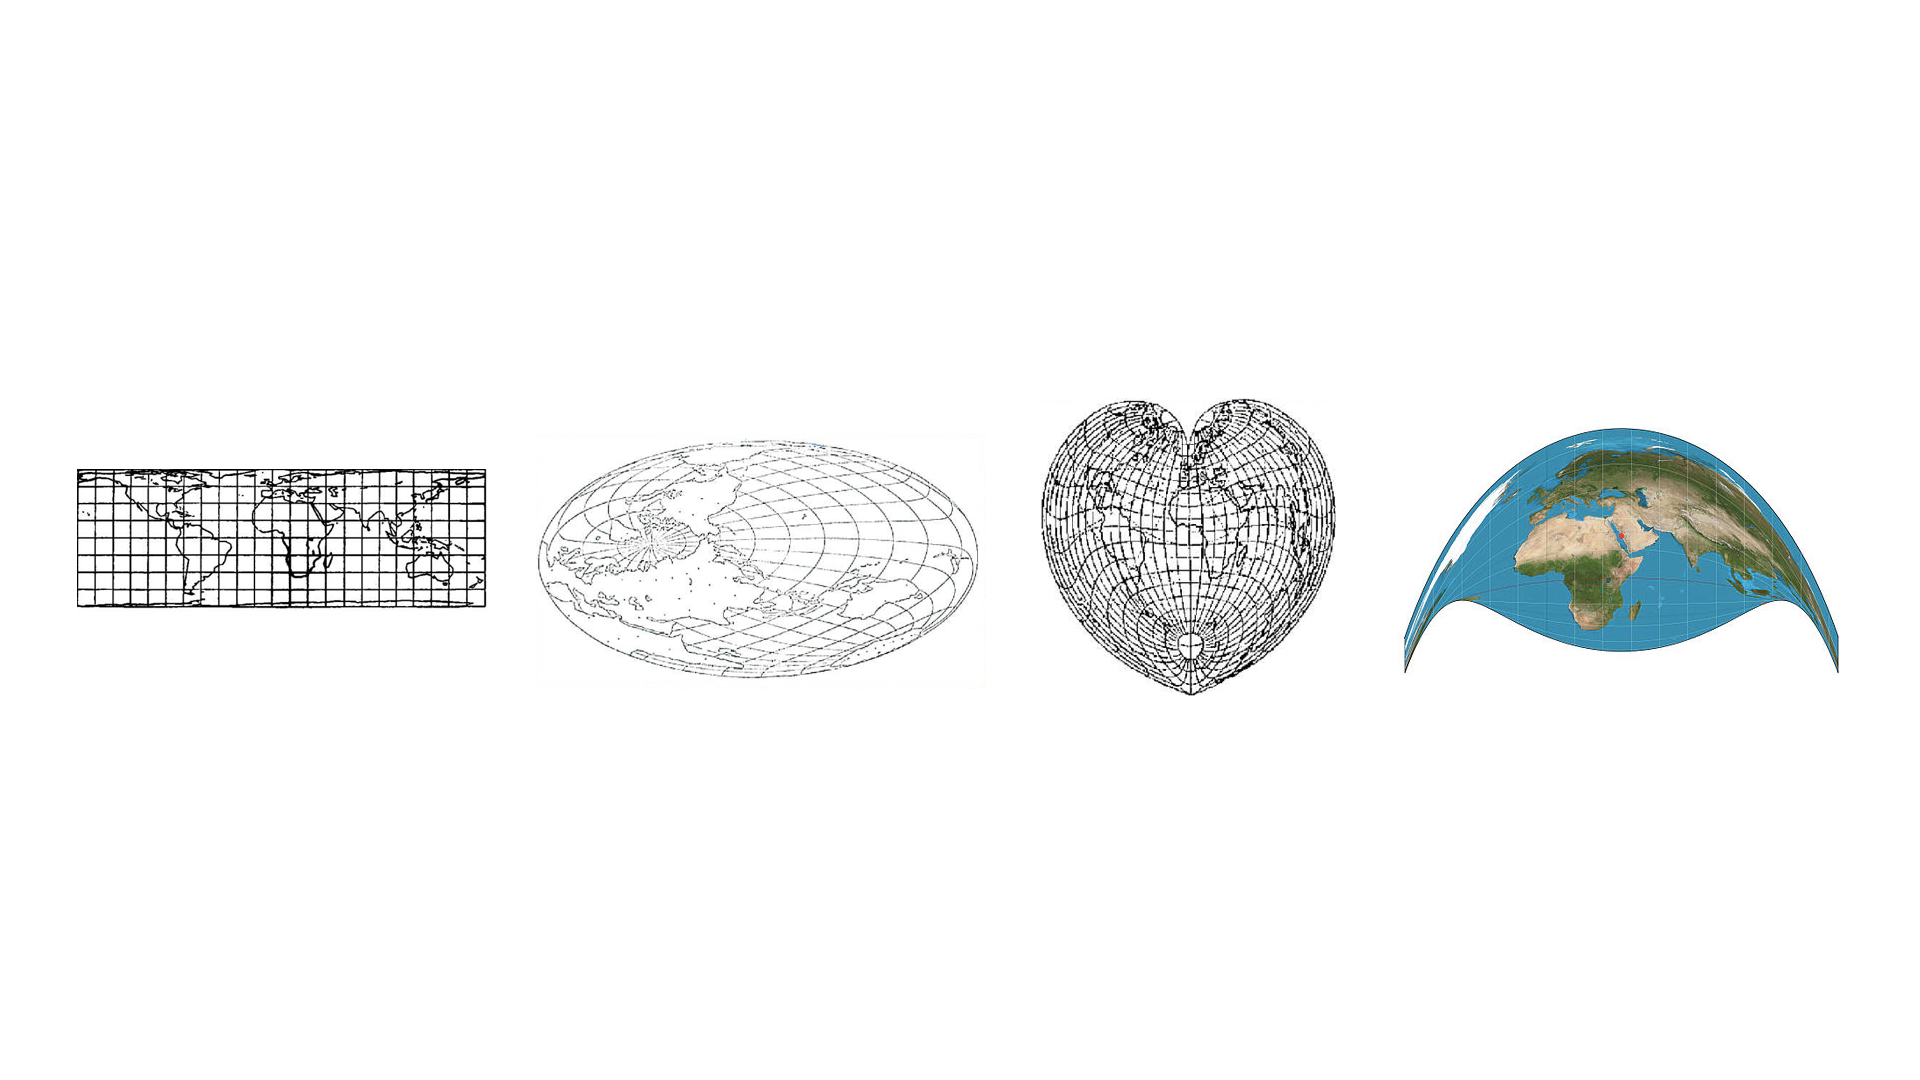
(As an aside, projections are such a powerful device both visually and as a filter for spatial information. To begin with, not every projection is made for a standard rectangular-plane. The leftmost projection above is designed to be used with mobius-like surfaces. Both of the middle projections conserve the distance or area from the center of the map, and distort distances/areas that do not include the center of the map. The rightmost projection, called the Craig Retroazimuthal Projection, is used to center a map around a geographical point, and distorting all else, in this case the center is Mecca. I personally feel it is a strong way to make a political point.)
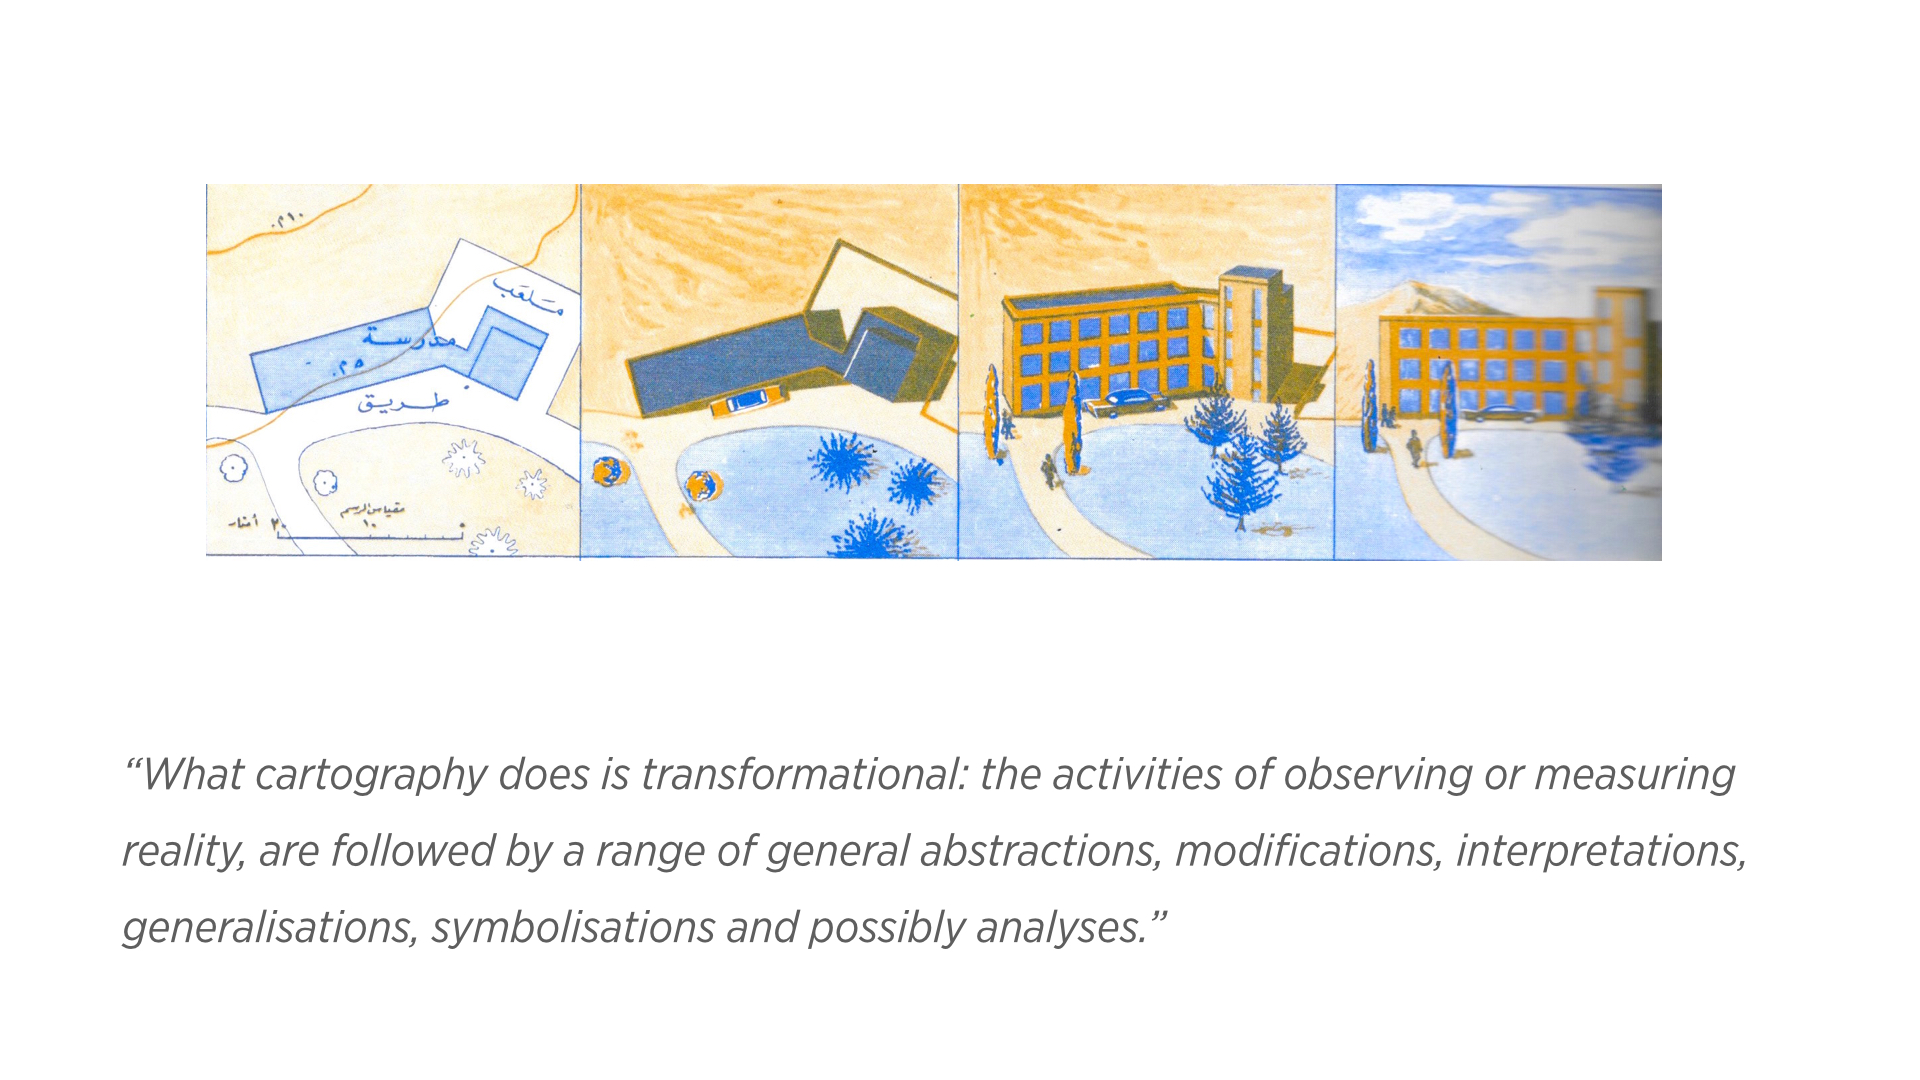
It is not only the choice of projection method, there is also an extensive process of “symbolisation,” i.e. mapping visual symbols to spatial (and non-spatial) data inherent in mapmaking. This is the essence of the cartography process; the seminal work of French cartographer and theorist, Jacques Bertin, as seen below, has set the principles of this process extensively and articulately. 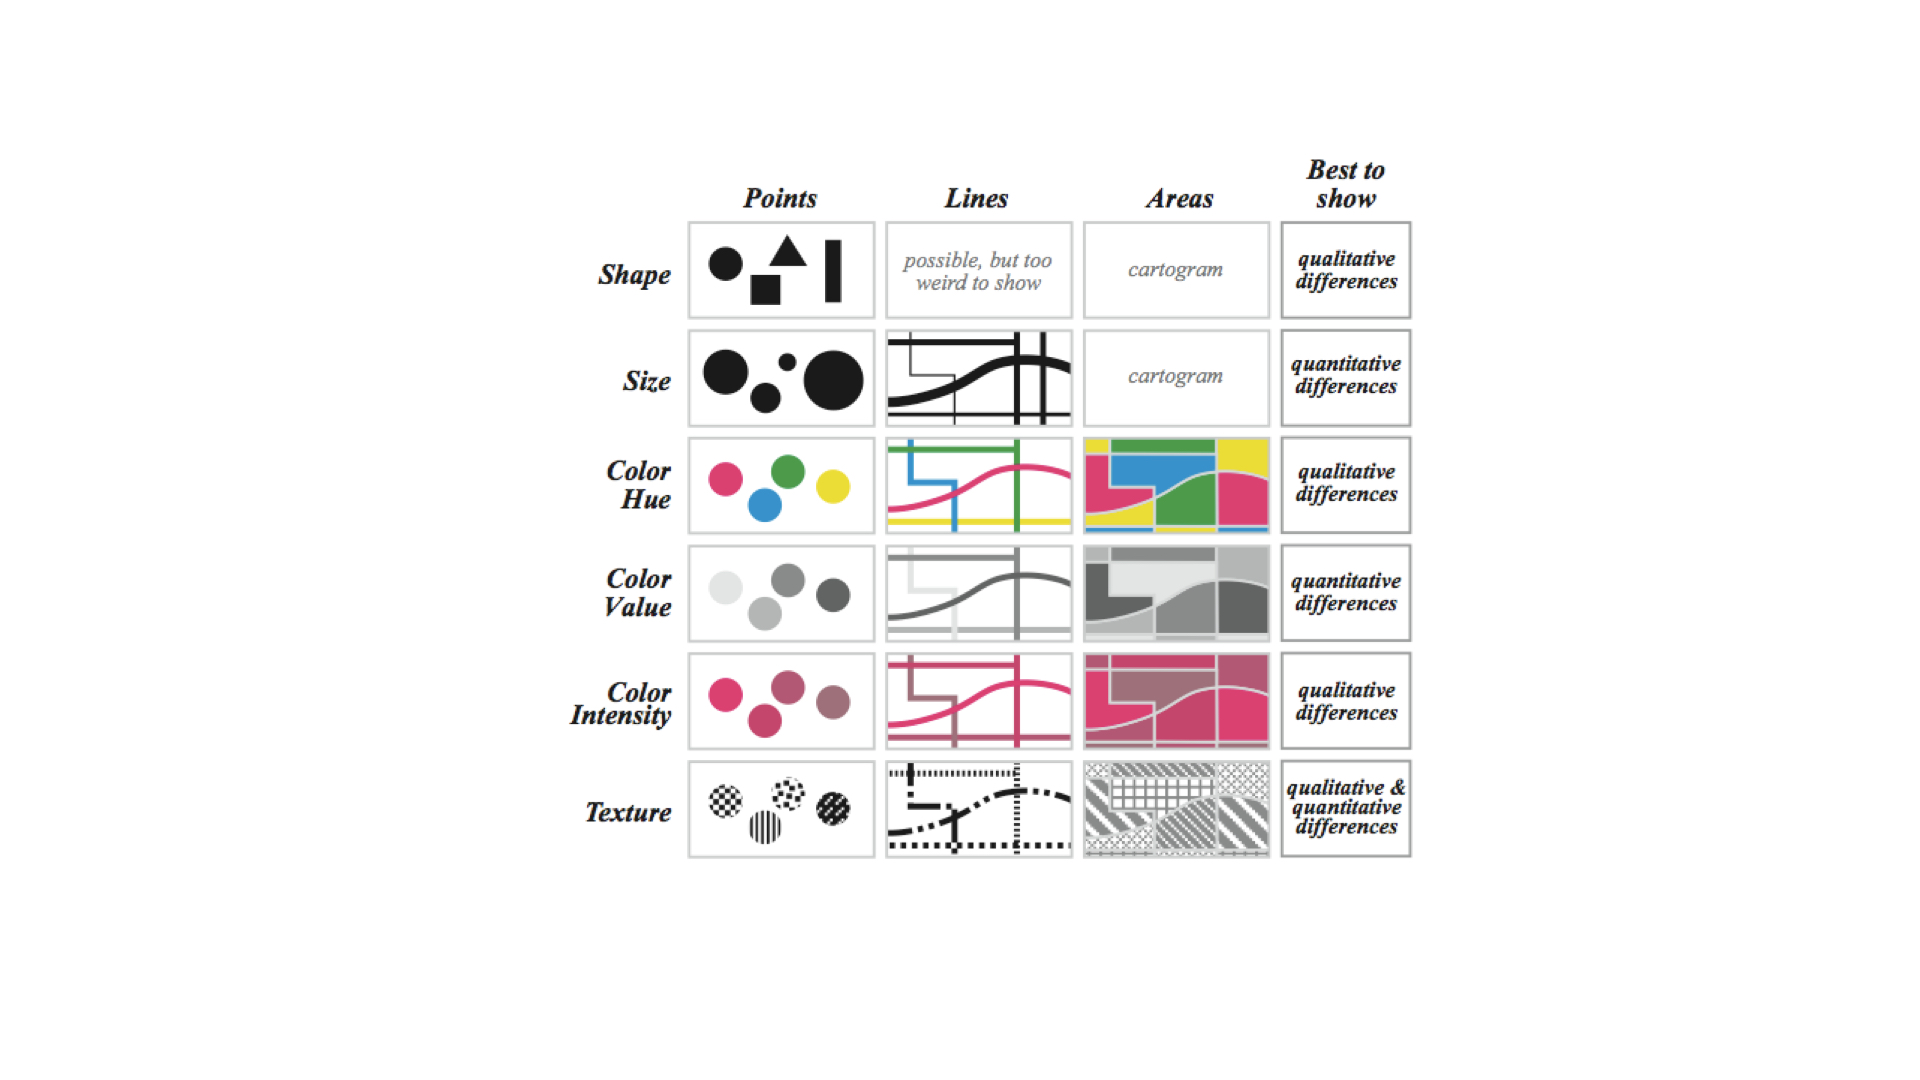
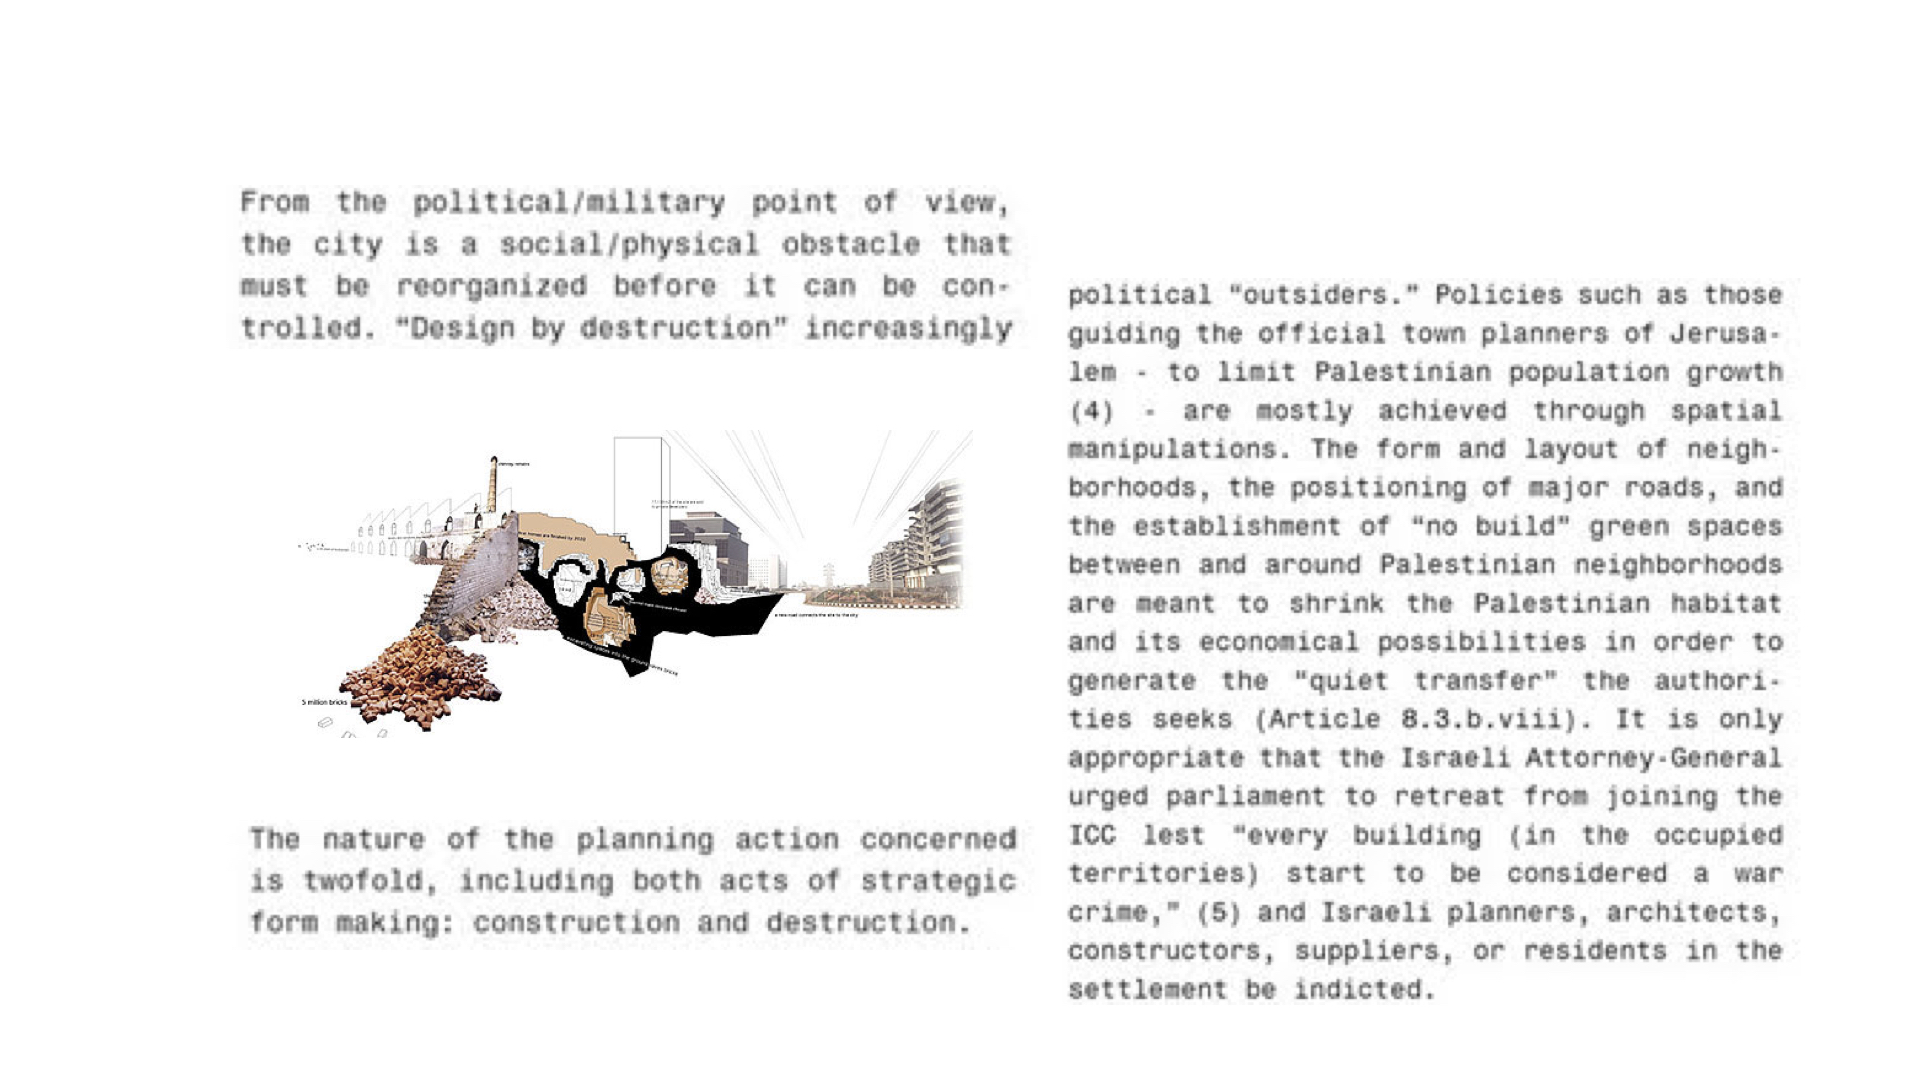
Maps are a tremendously powerful thing. In a way, a map is a blueprint for wars, and a war is effectively a man-made change of geography.
Eyal Weizeman, notable Israeli architect and intellectual, goes as far as to argue that architects, and by extension, urban planners and cartographers, should be held equally accountable for some acts of war that involve “design by destruction.” The danger of their work is not only in the process of planning war efforts, but also in the way urban colonization is made concrete in the layouts of captive cities, in the spatial control of how materials flow to captured places. 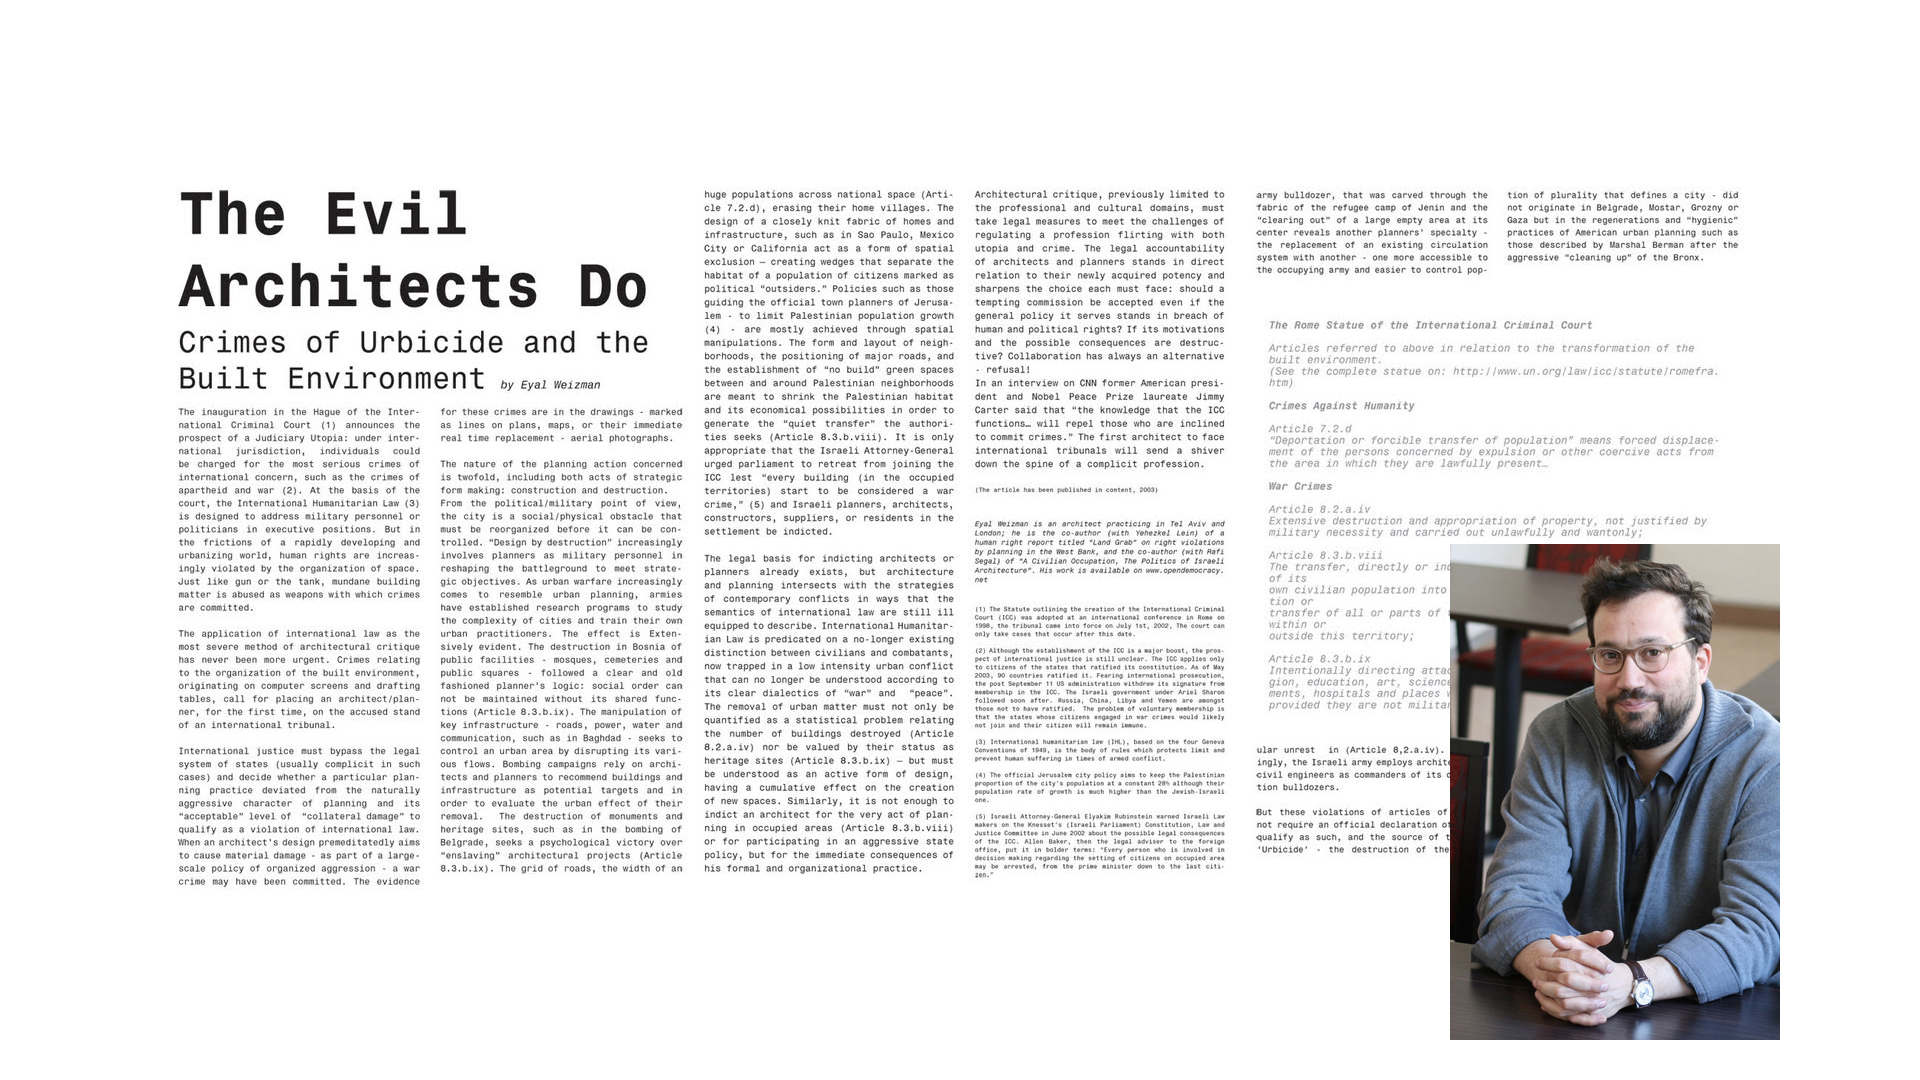
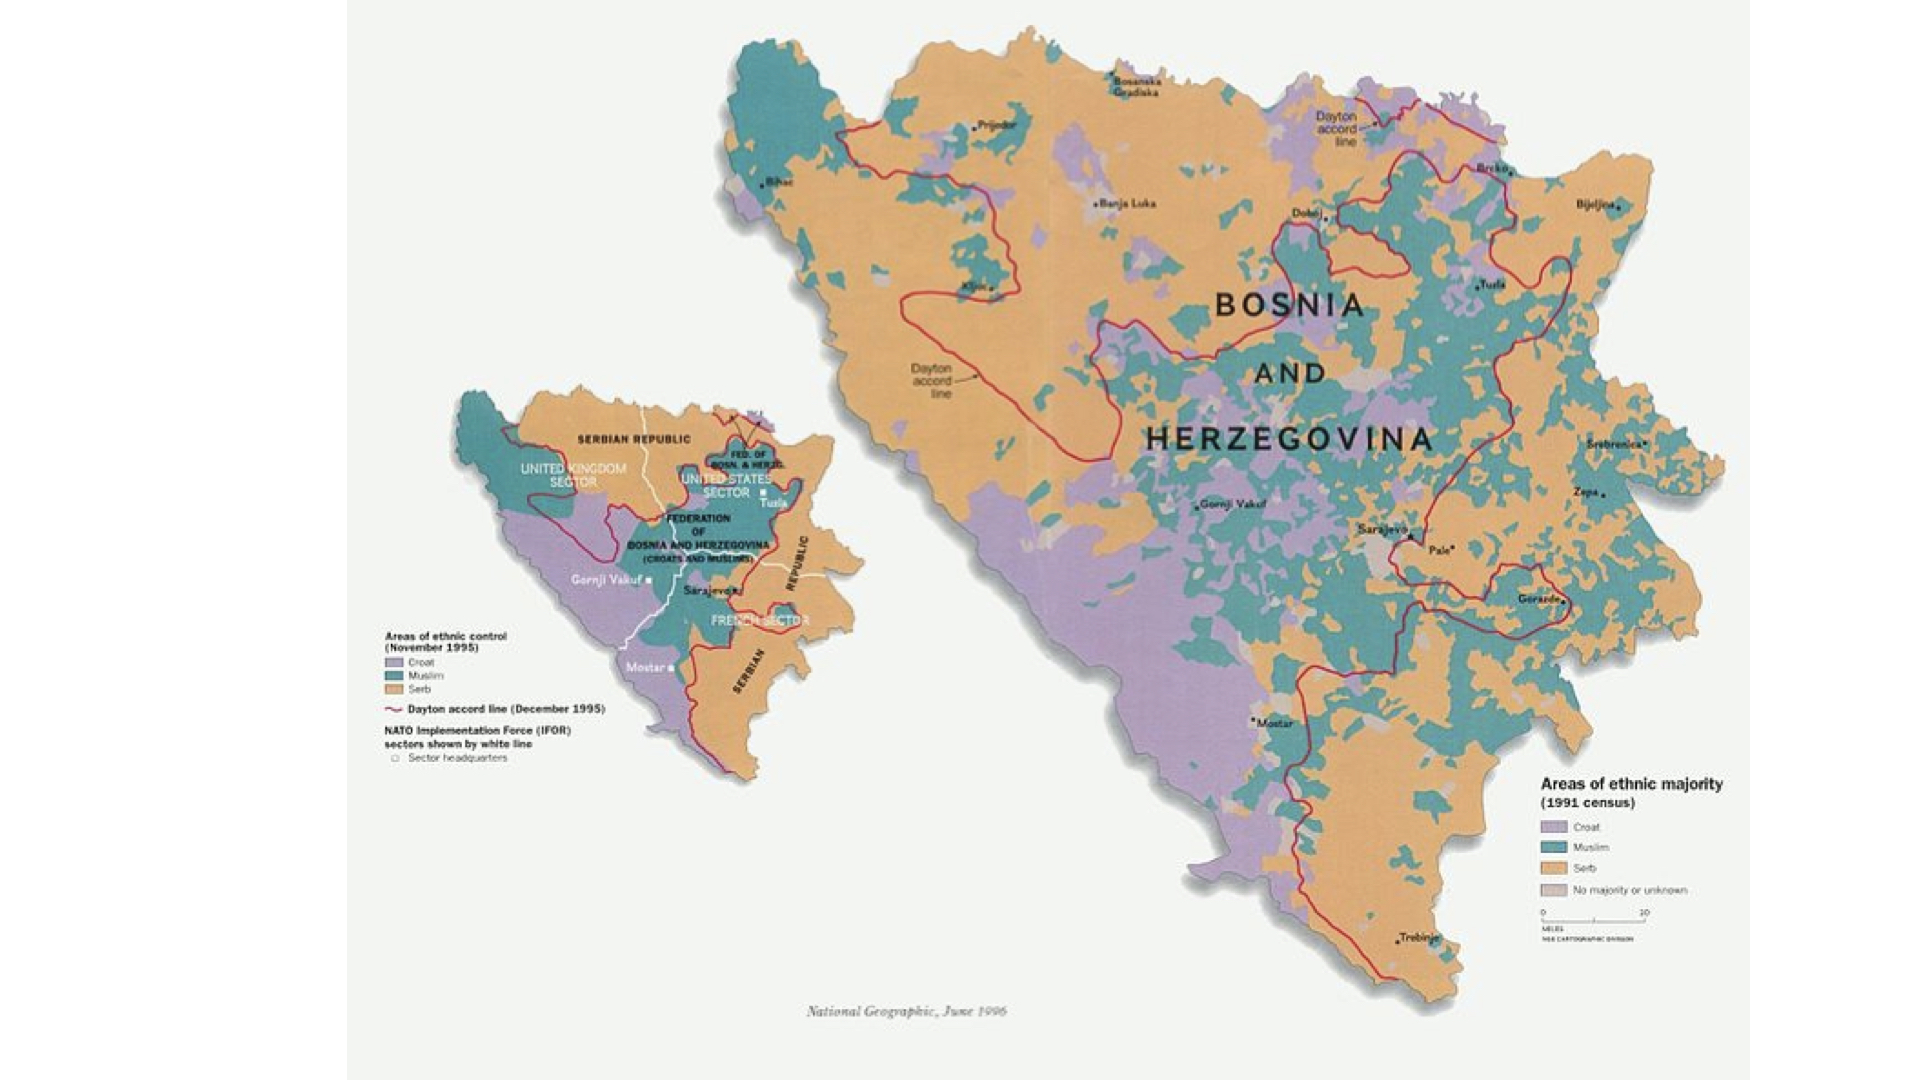
A clear example of the way wars are a change of maps, is the reshaping of Bosnia and Herzegovina after the 1991 civil war. Before it, the ethnical markup was nebulous, and after it, the region fell into a neatly organized set of ethnically segregated areas.
Maps are also as much of a tool of resistance as they are for occupation. 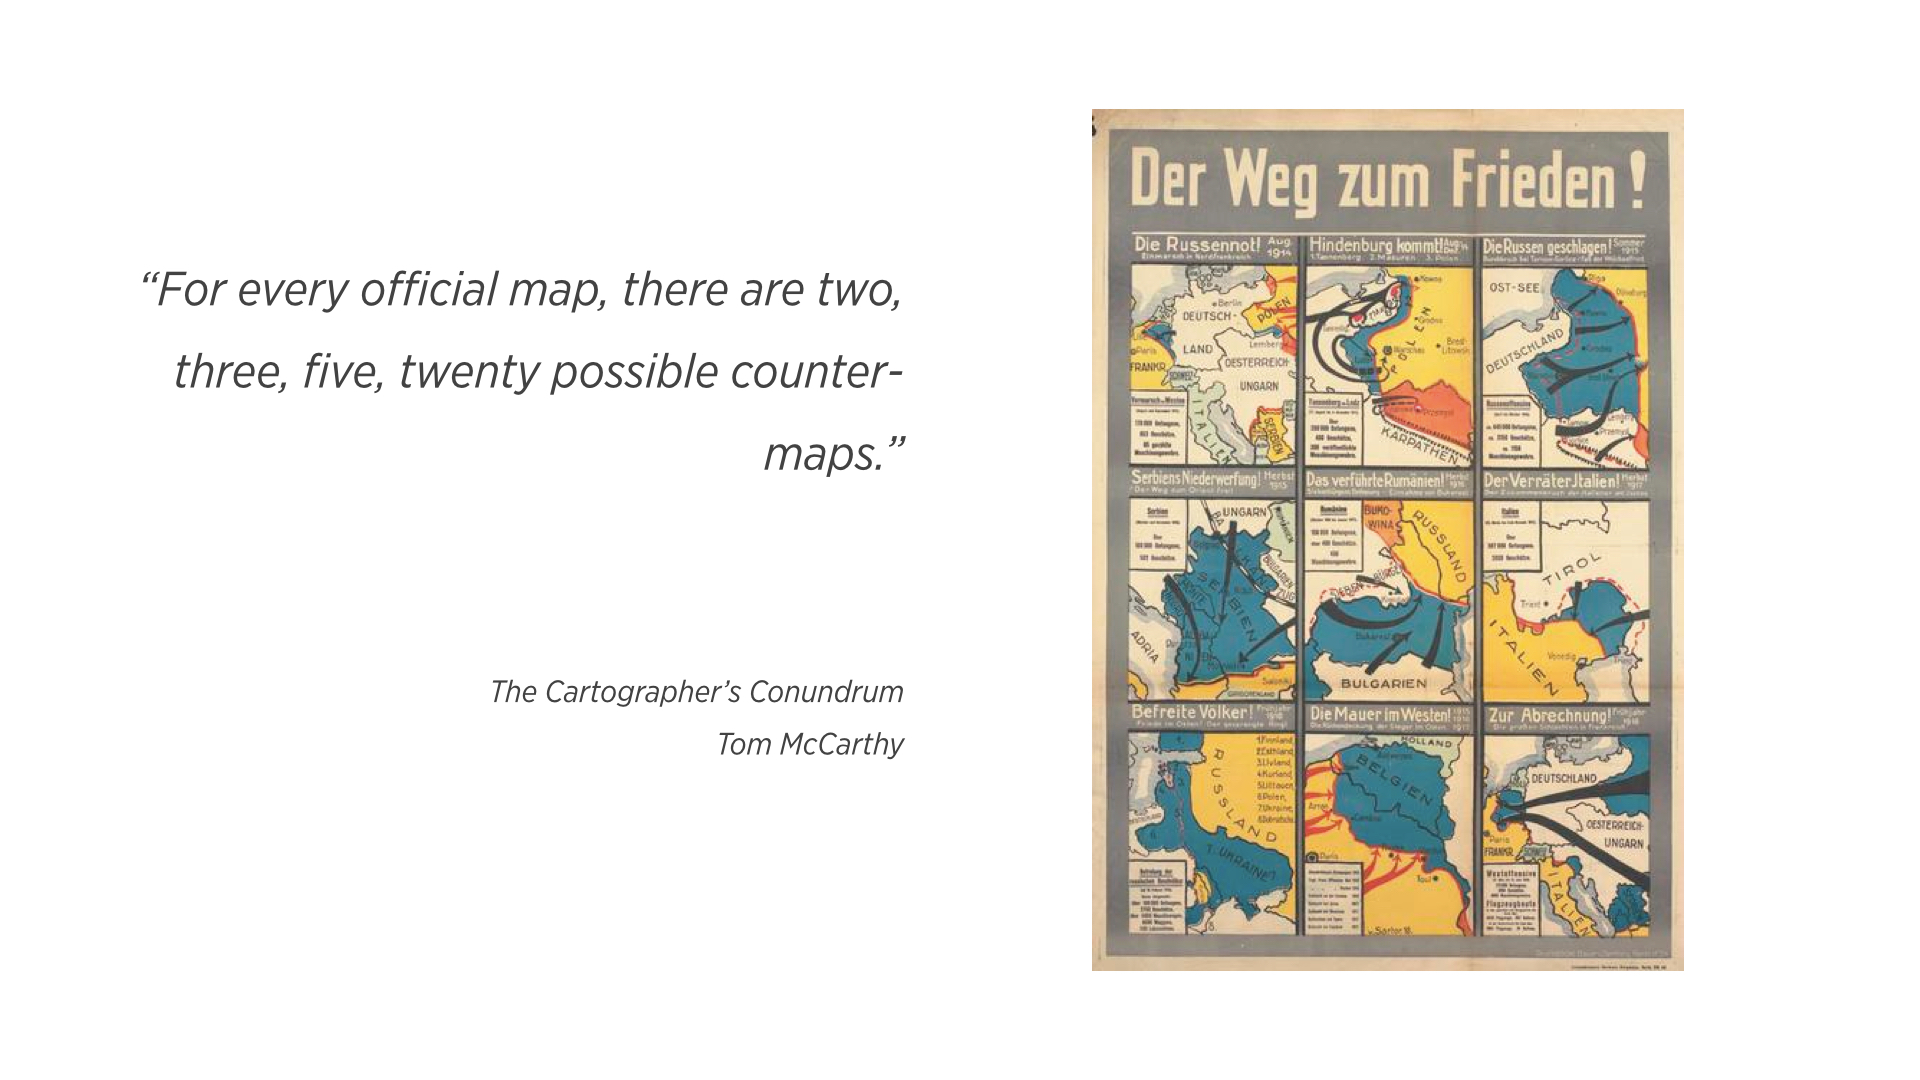
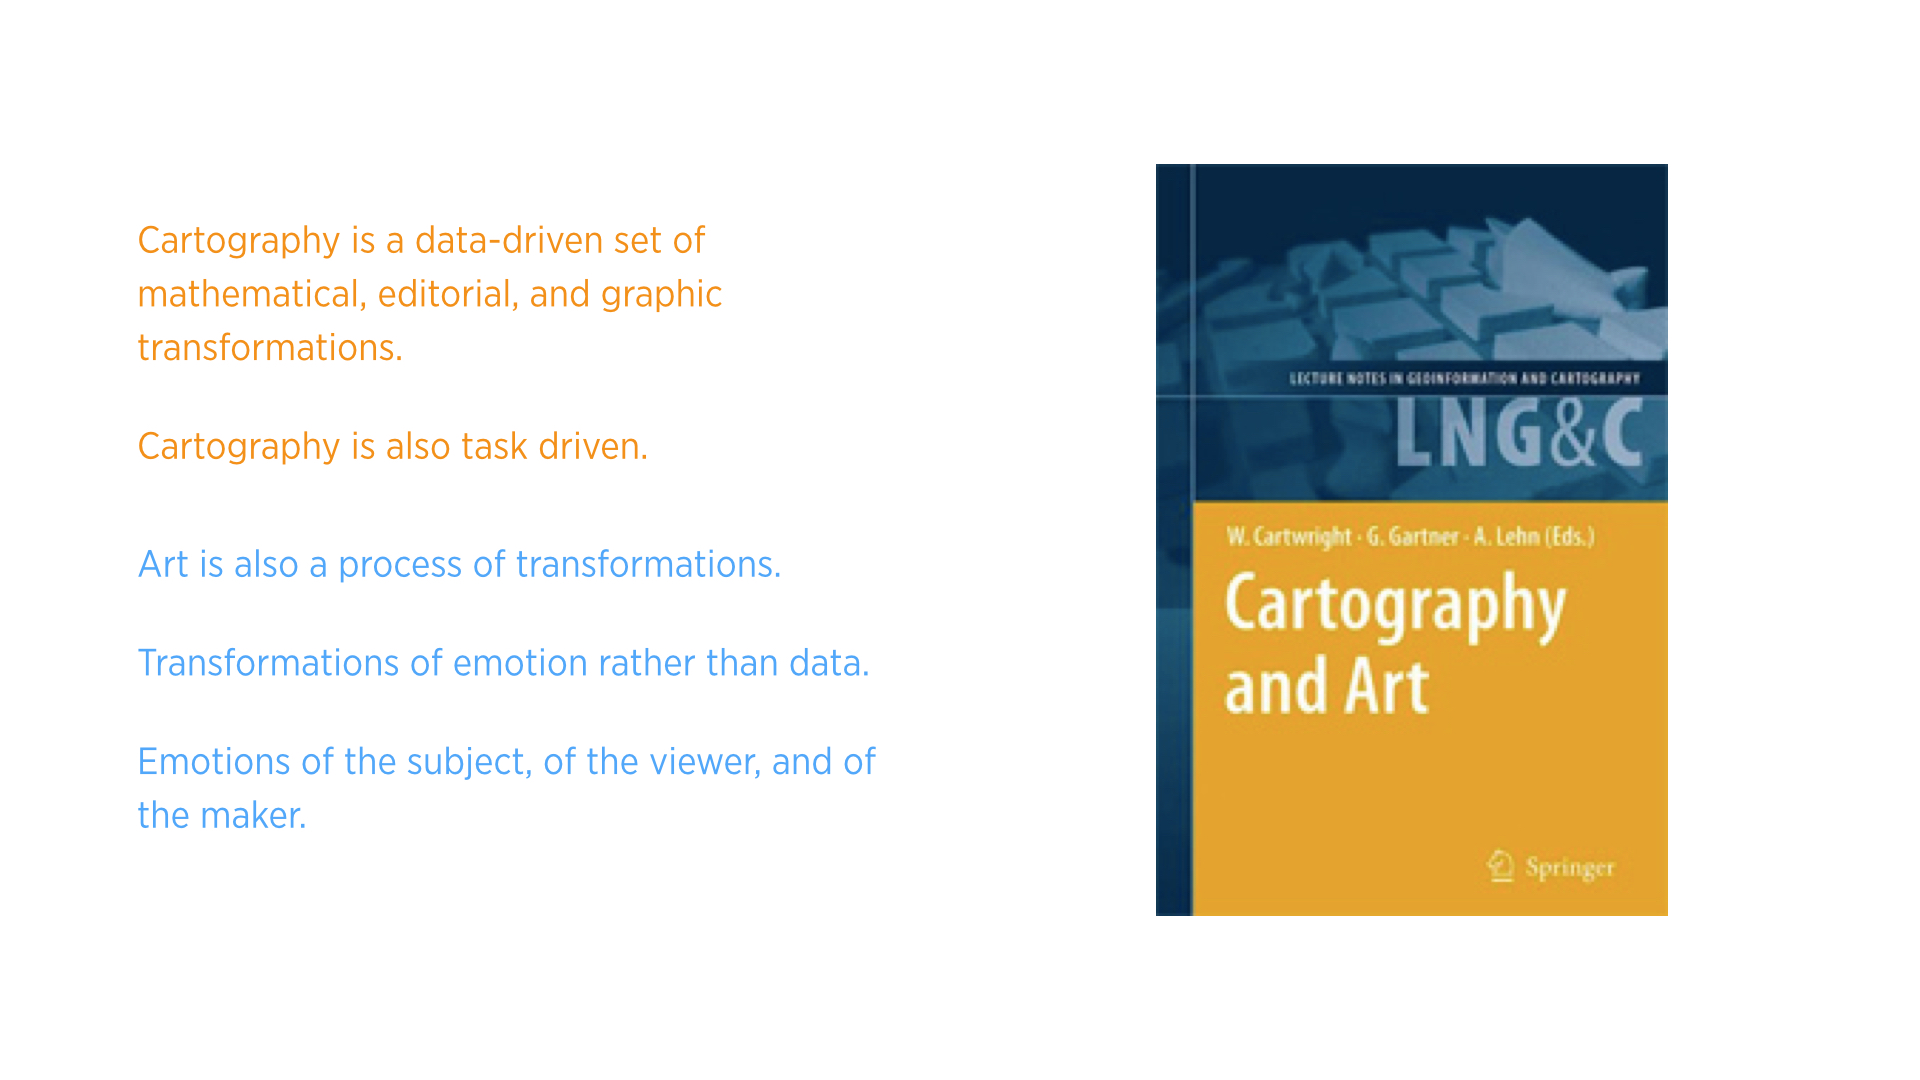
One prevailing theory of the progression of art is that, after the Renaissance, works of art were made, generally speaking, to map the emotion of the subject matter to the art’s medium, and in a way, to elicit an emotional response in the audience. Ernst Gombrich argues that, by the end of the eighteenth century, artists were expected to map their state of emotions rather than that of the subject matter or the viewer. 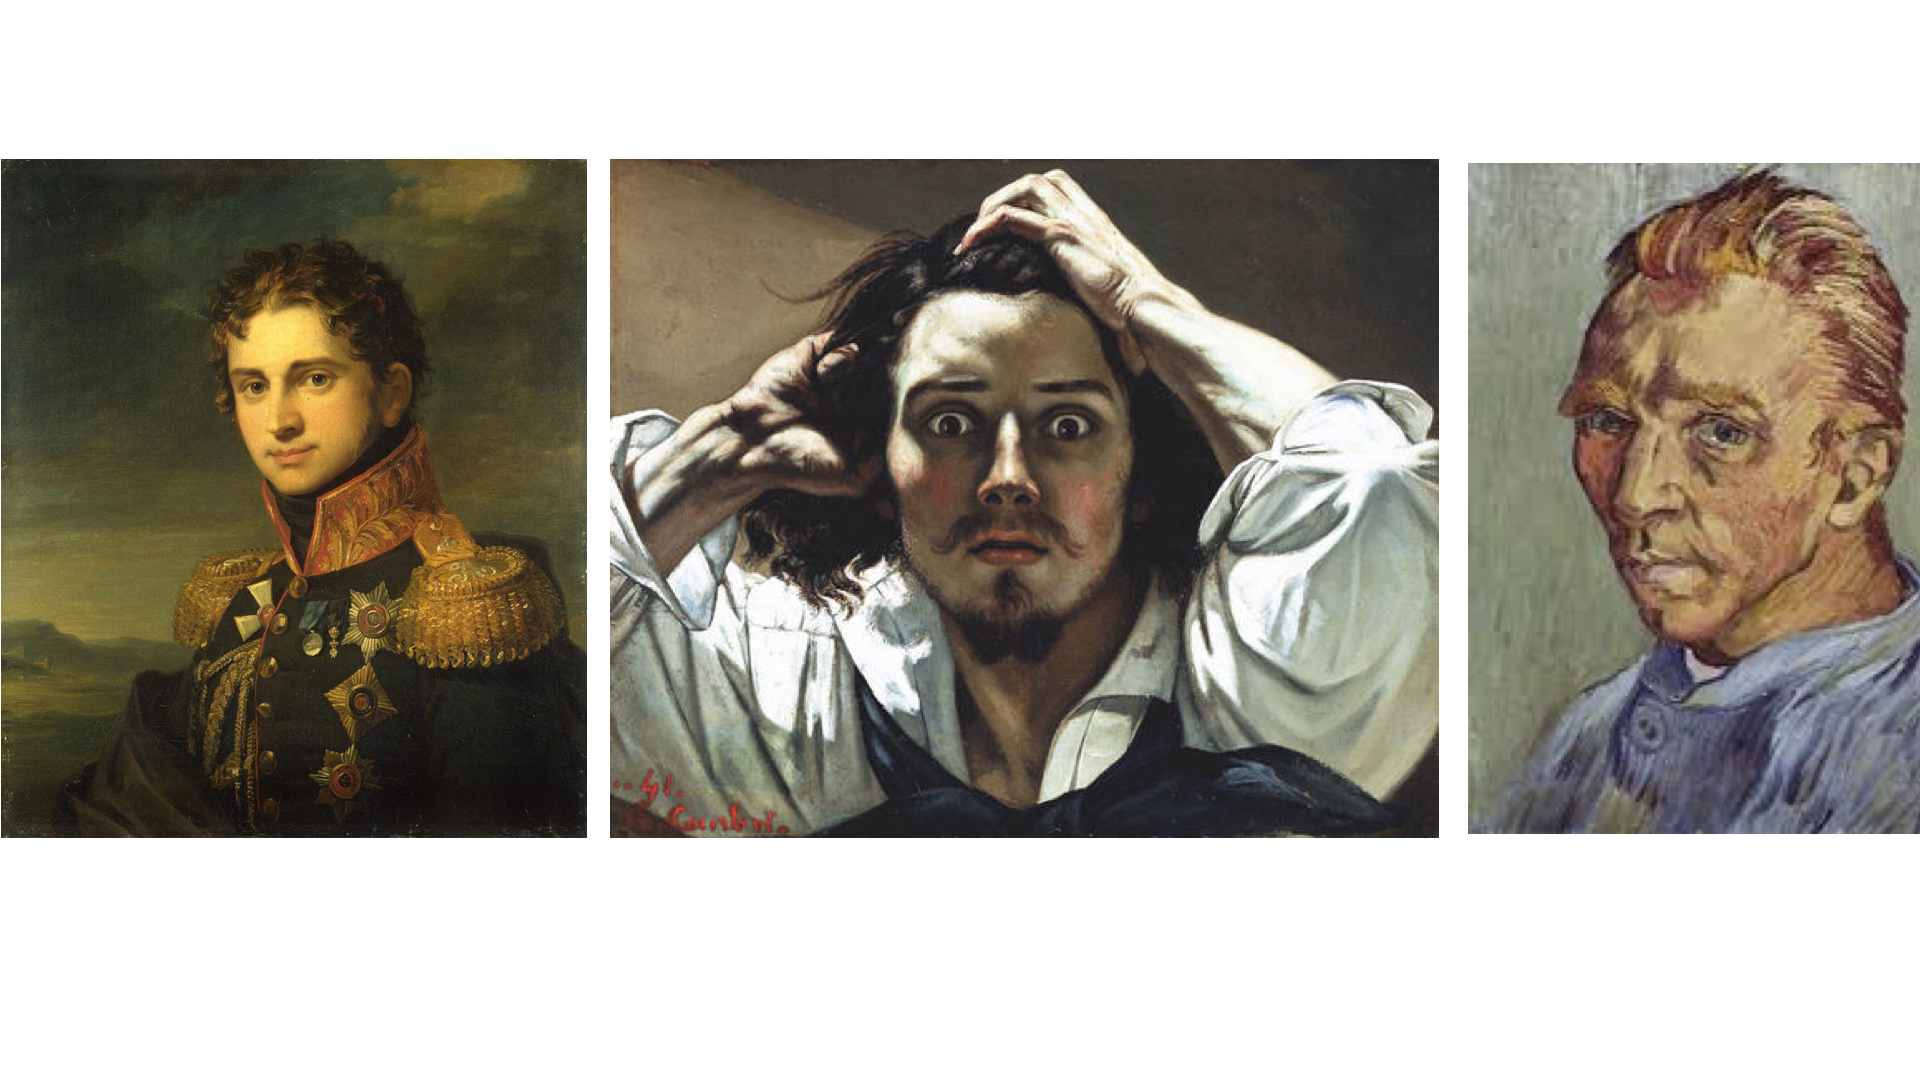 Cartography moved, and still does, in the opposite direction. Due to the limitation of technological means in primitive times, maps started as a subjective visual works that convey an impression more than information. Modern maps are more about information, but not completely about that.
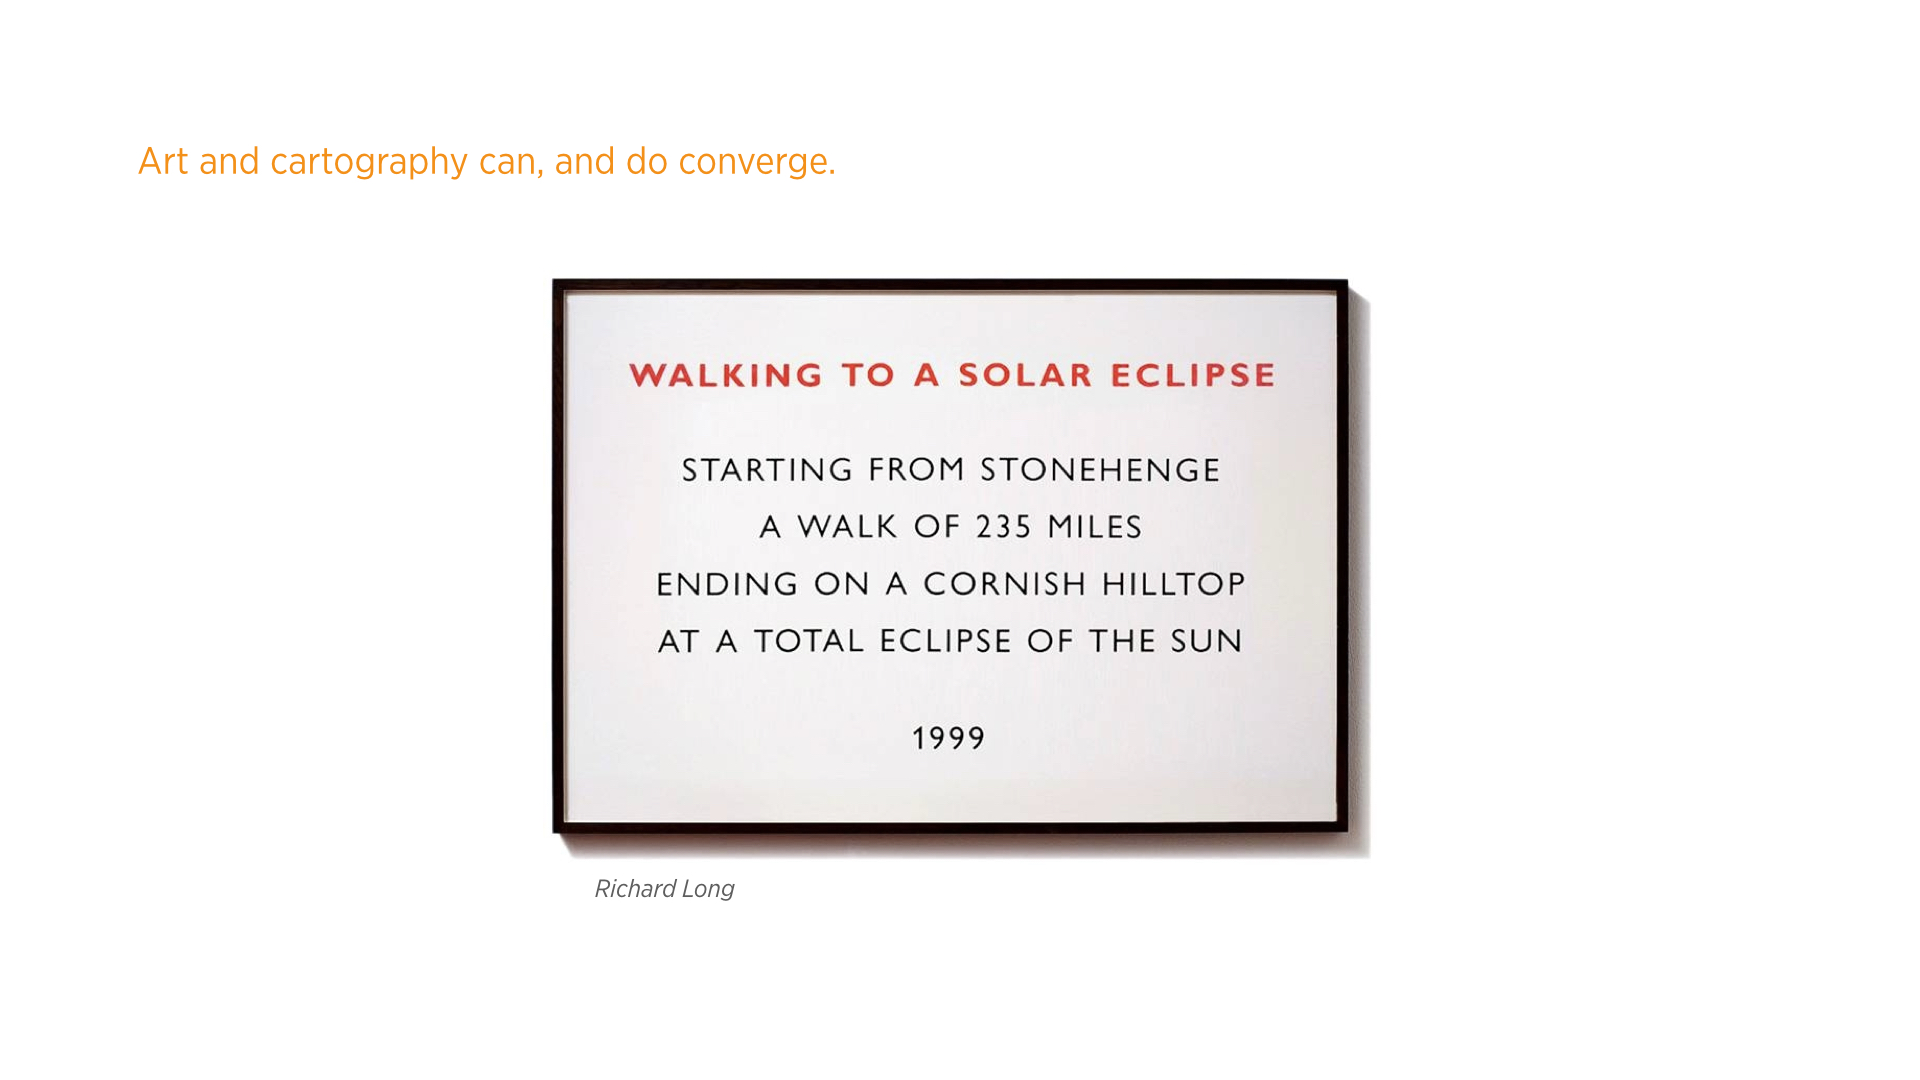
 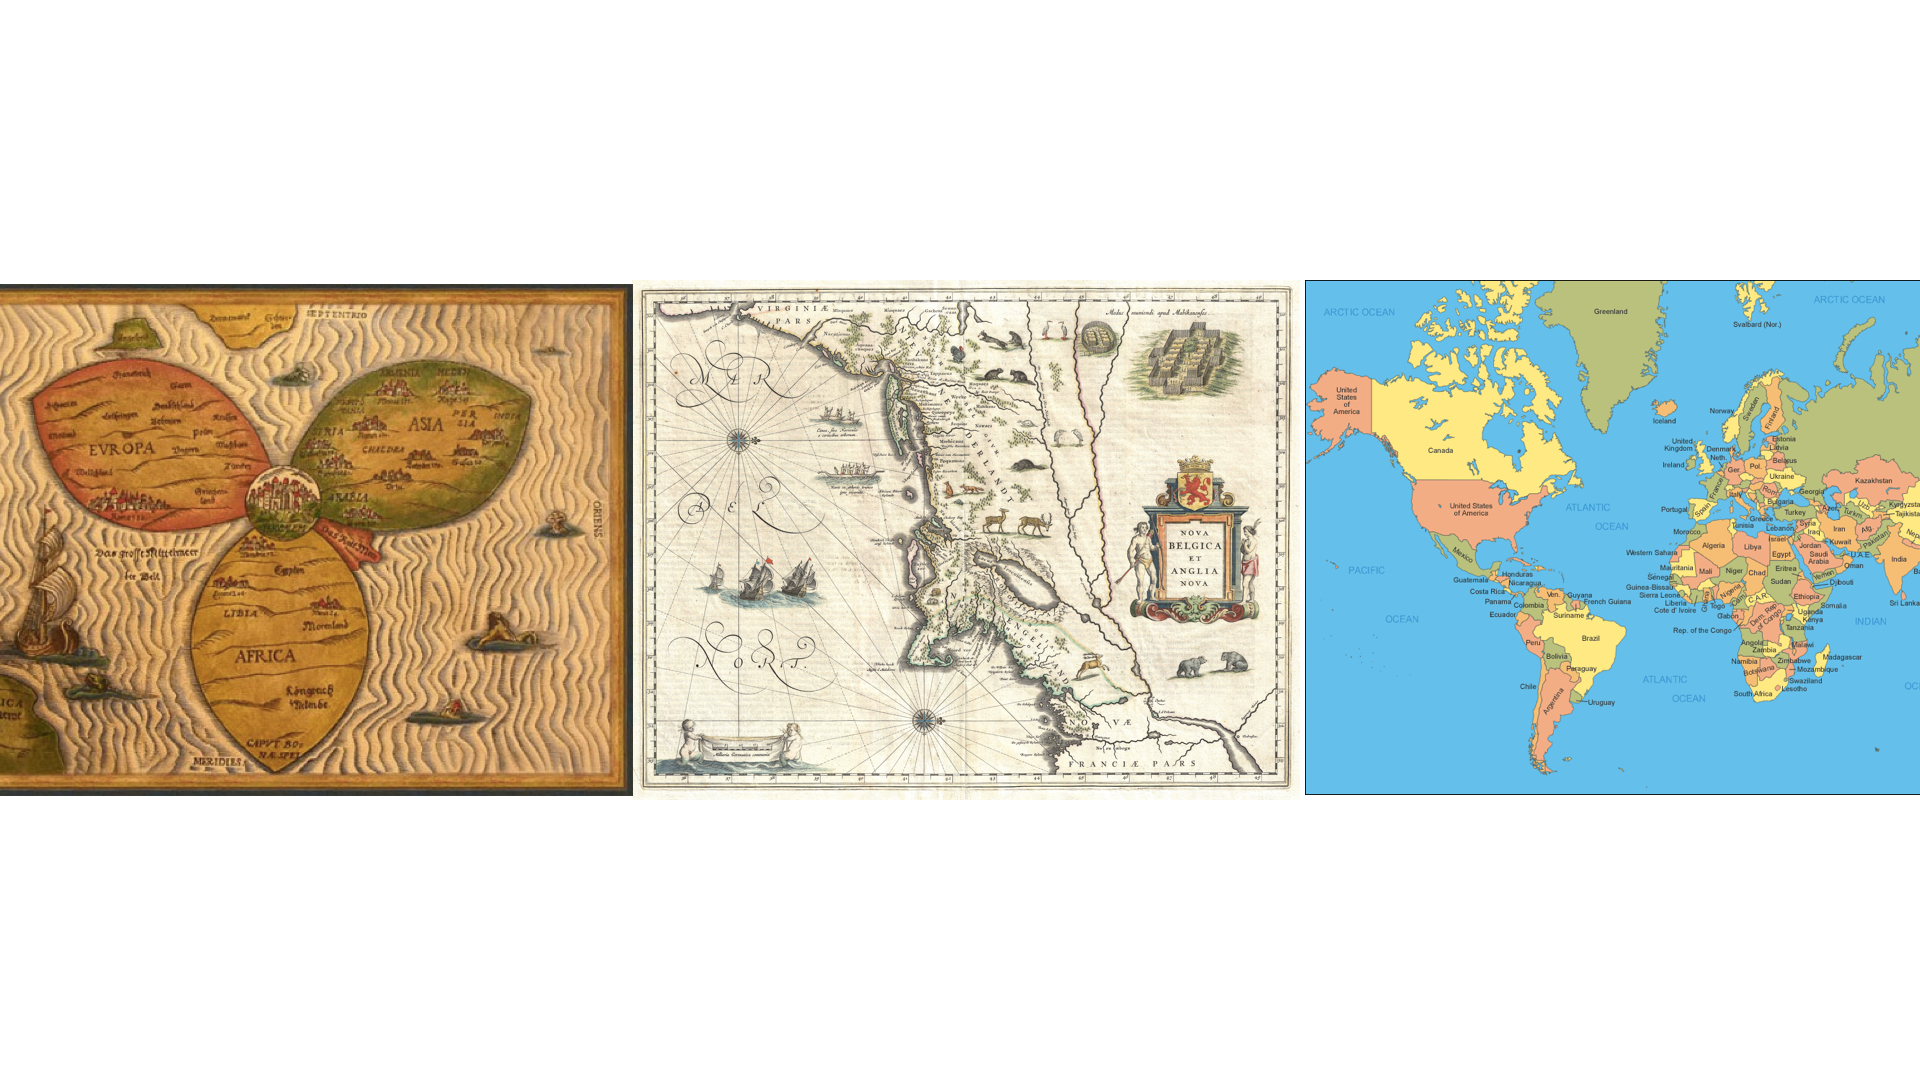 The point of the above is that cartography and art should not be necessarily considered too far removed from one another. Cartographic art, whether in the sense of “cartography-assisted performance art” as with the work of Richard Long, or maps that impress more than enlighten, is, in my personal opinion, as aesthetically and conceptually powerful as a painting.
The final thing of note in this line of thinking is the idea of space itself. Space has been defined and redefined in all philosophical manners throughout time, from the idea of space being relational, to the scientific idea of the convergence of time and space in the concept of spacetime. What is space anyway, and why should maps be about a single institutional idea of it?
 LIST OF SOURCES, IMAGES, AND MORE:
Image: McArthur’s Universal Corrective Map of the World
“Maps are broken..”:
Ideas: The Mapmaker’s Conumdrum, Tom McCarthy, The New Yorker
Ideas: Mapping It Out: An Alternative Atlas of Contemporary Cartographies, Hans Ulrich Obrist
Image: Postcards from Google Earth , Clement Valla (color corrected by me to suit the color theme of the slideshow)
Ideas: Cartography: Thematic Map Design, Borden Dent , Jeff Torguson , Thomas Hodler
Image: The World’s of David Darling, David Darling
Ideas + Images: Unusual Map Projections, Waldo Tobler
Image: الأطلس العربي World Atlas (Arabic)
Ideas + Image: Semiology of Graphics: Diagrams, Networks, Maps, Jacques Bertin
“Maps are violent..”
Ideas: The Mapmaker’s Conumdrum, Tom McCarthy, The New Yorker
Quote: Cartography: Thematic Map Design, Borden Dent , Jeff Torguson , Thomas Hodler
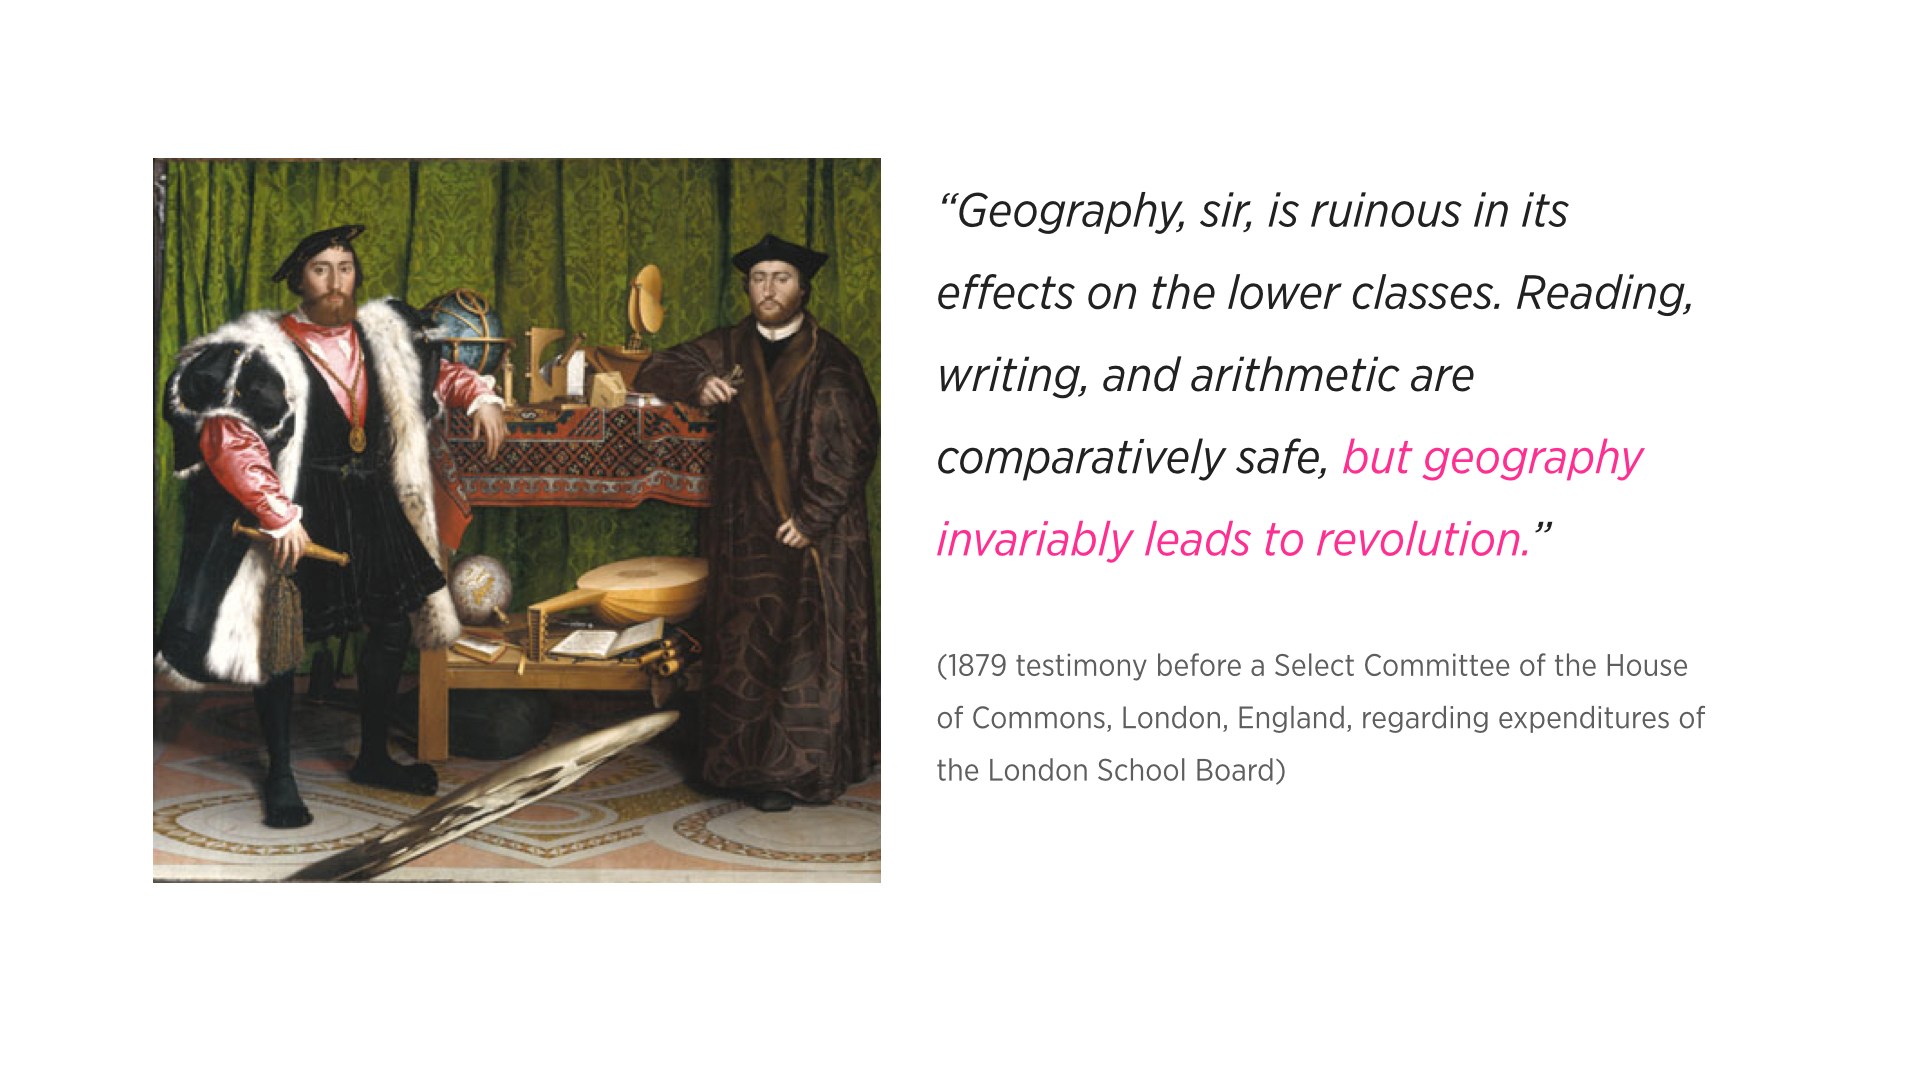
Image: Hans Holbein’s The Ambassadors
Ideas: The Evil Architects Do, Eyal Weizman
Image: Faustian Urbanism, Manuel Herz, Eyal Weizman
Image: Bosnian Census, Wikipedia
Image: The Way to Peace! Nine maps of German campaigns from August 1914 to spring 1918.
“A Map is not a painting..”
Ideas: Rejecting Illusionism: Transforming Space into Maps and into Art, David Fairbairn, from Cartography and Art , edited by Cartwright, William, Gartner, Georg, Lehn, Antje
Image: A Portrait by George Dawe
Image: Gustave Courbet self-portrait, “The Desperate Man”
Image: Vincent van Gogh, Self-Portrait
Image: Richard Long’s Walks
Image: Night Shift/The Wrong Map 2004 by Adam Chodzko
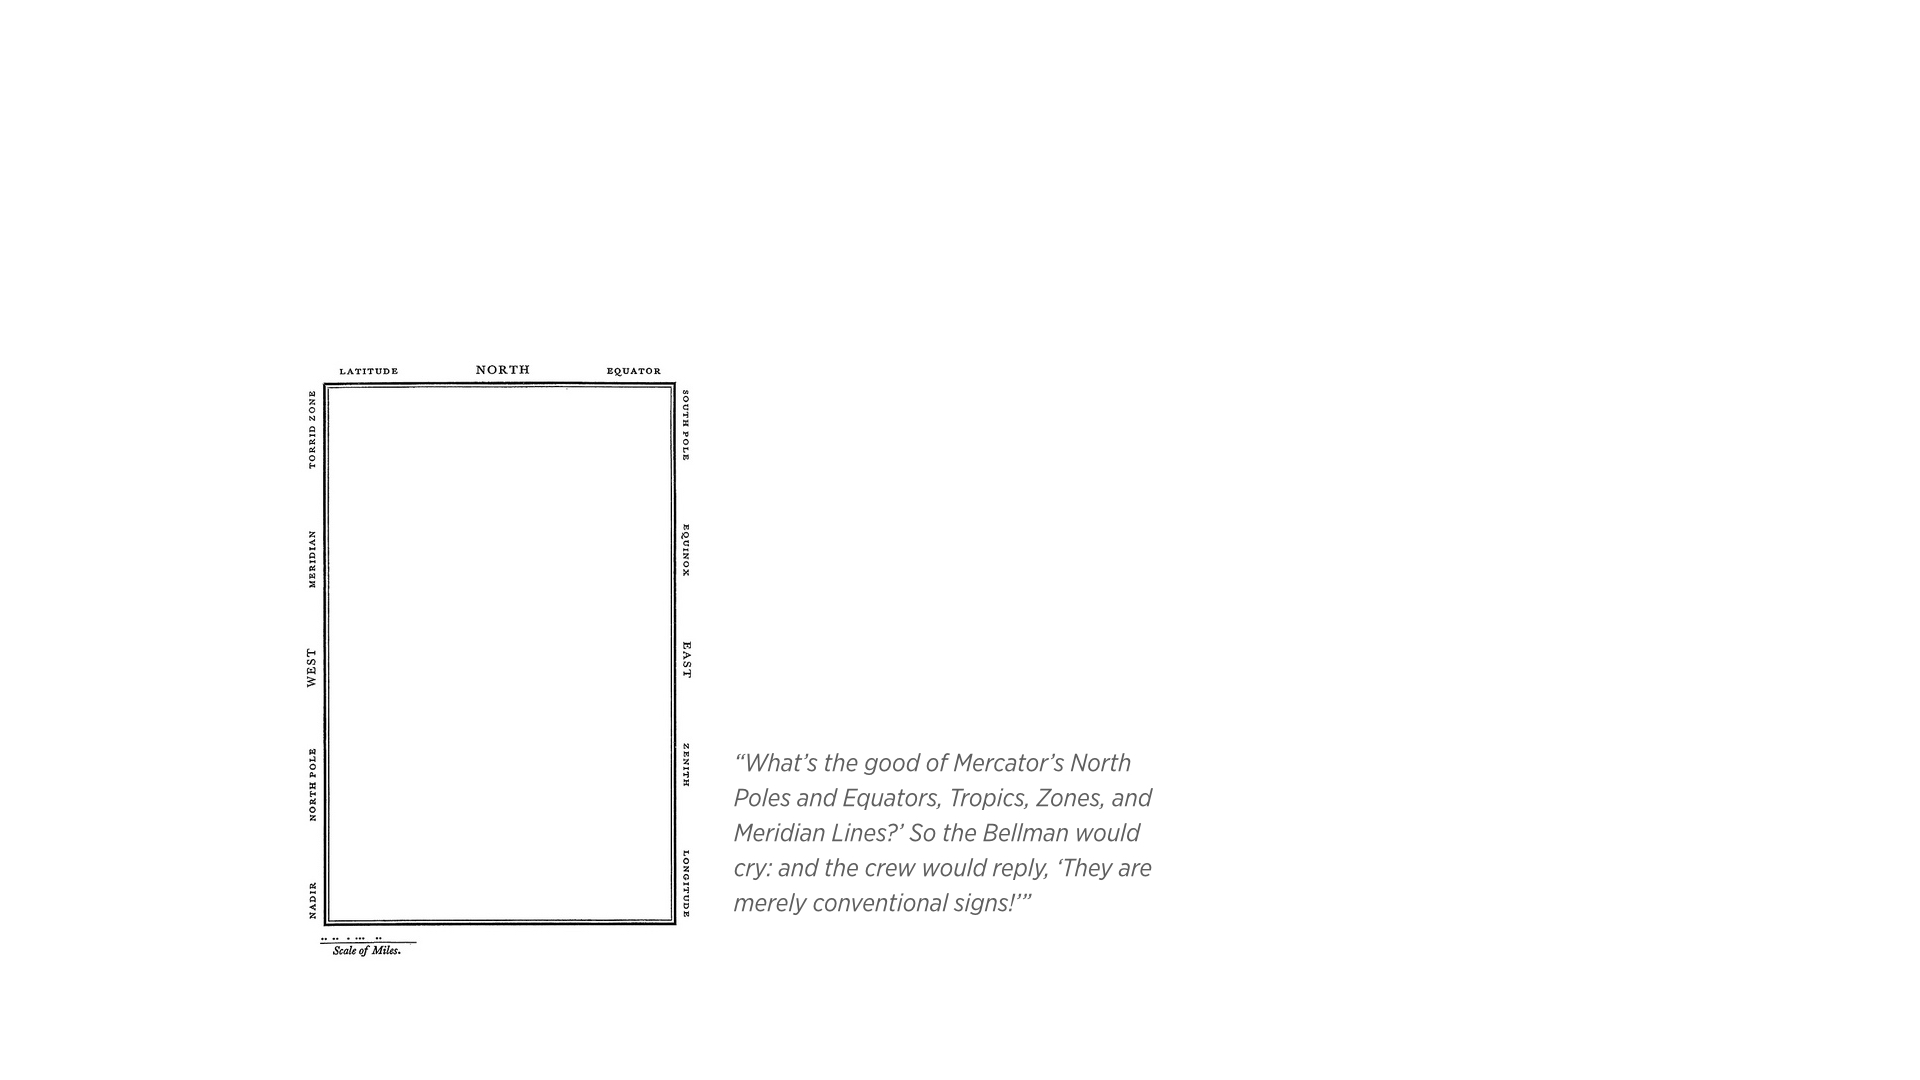
Image: Oceanchart (from Lewis Carroll’s The Hunting of the Snark)
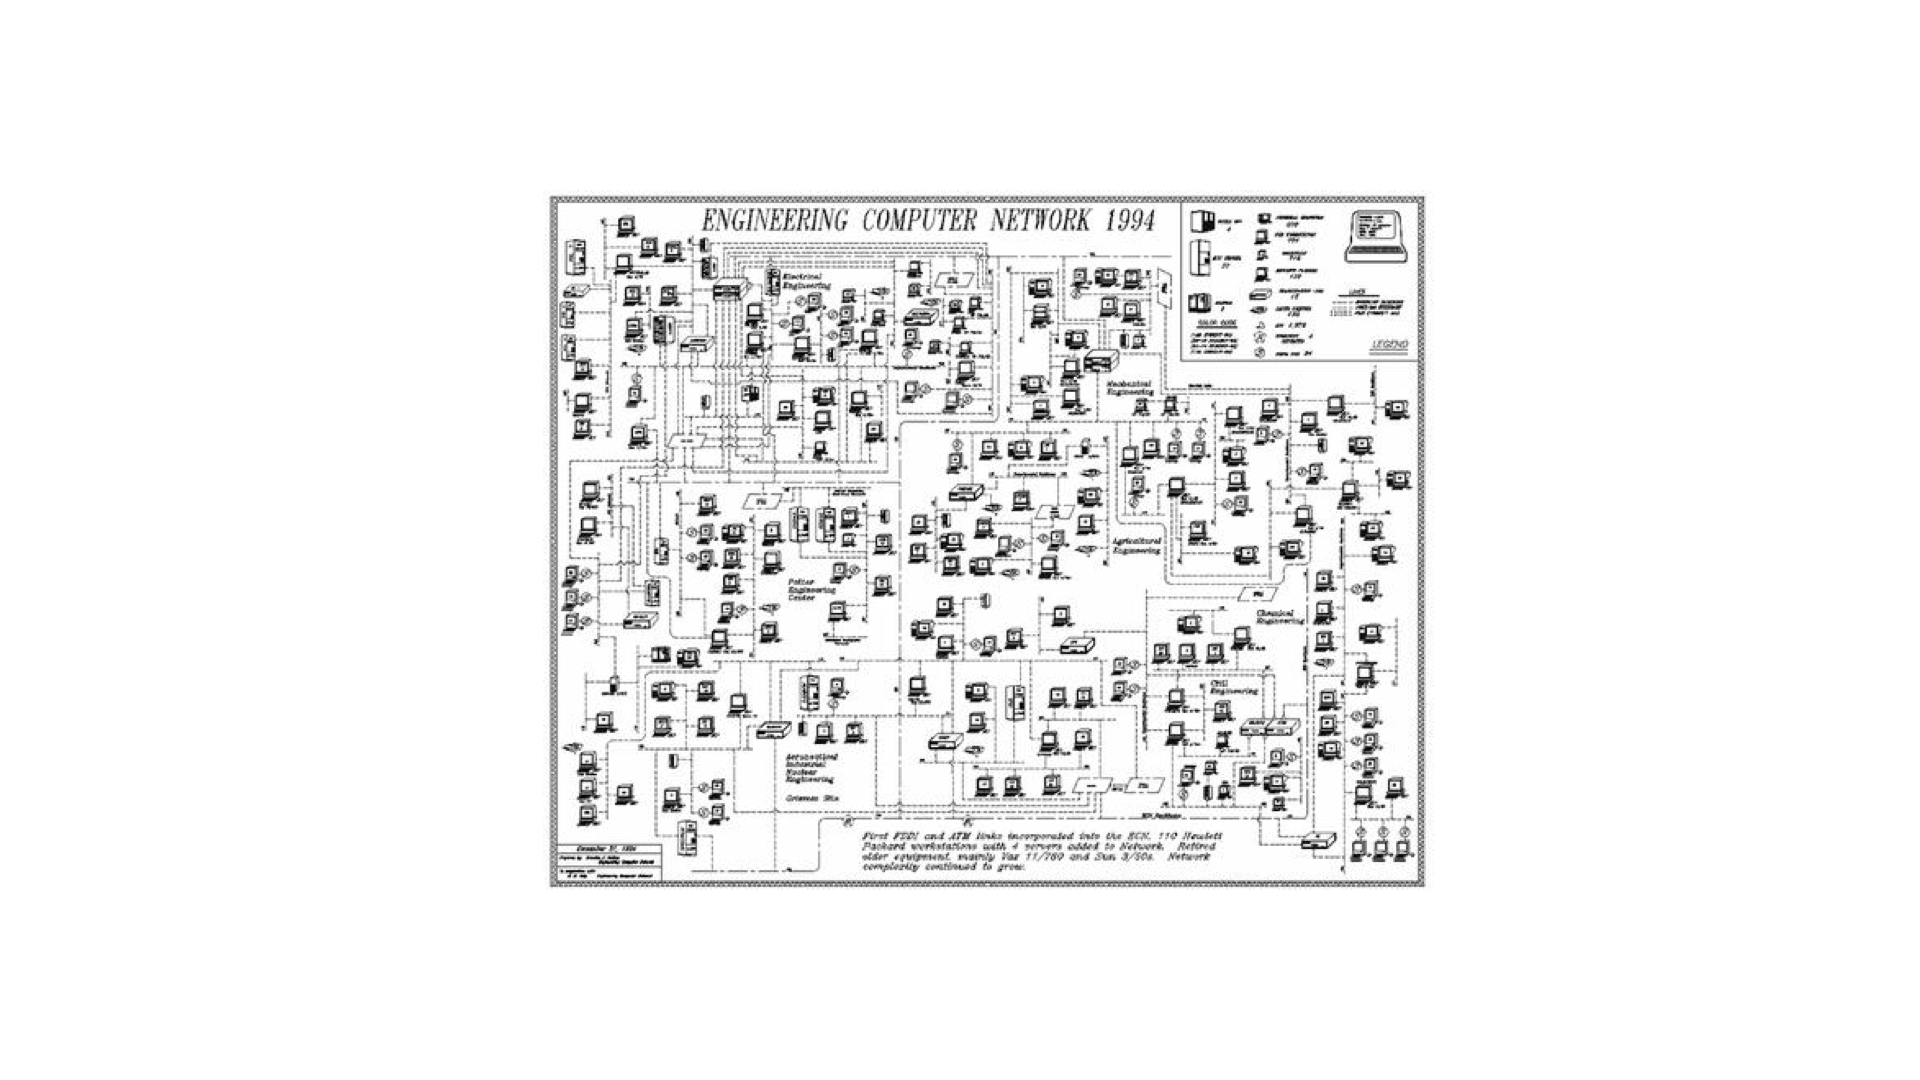
Image: 1994 ECN Network Map
This week I started conducting user-testing for my Online Wayfinding System project (non-fancy name pending).
The below is a list of common observations I received from the people I interviewed.
1. Tooltips should be displayed regardless of the location on which the mouse is hovering (at the moment they only show if the mouse is placed on the edges of the node).
2. Time-related information should be included there somewhere, e.g. when did I start the session? How long did it take?
3. The hierarchy of information needs to be improved. (At the moment, I have the nodes from which more nodes spawned increase in size, but not very dramatically).
4. Consider filtering and searching mechanisms, including zoom in and out.
5. The color scheme is generally good. But consider having the ability to pick alternative palettes.
6. The session aggregation screen needs work. It is unclear at the moment.
7. Consider having all sessions in the same view.
8. Shapes are hard to grasp at the first view, but legend helped a lot. Consecutive views are much easier to read.
9. Consider having the content annotations integrated into the symbols, instead of the current mechanism of hovering over a symbol to view them.
10. Consider adding more text description on the session view.
11. Highlighting techniques might improve the information display.
Inspired by Richard Long’s Textworks, and as part of my Temporary Expert research about maps that are not strictly geographical, maps that are not used as a reference, or ones with a non-pedagogic agenda, I started a daily exercise in the last couple of weeks to create “textmaps” that are more of cryptic, cheesy description of said maps.
This is a “song” (if you can stretch the definition of that far enough) that I had to write and “perform” (read: read) as part of my temporary expert research project on shipwrecks. I am including it here so that I can always find it if I am in the mood to feel awkward.
(This is in relation to my ongoing Online Wayfinding System project.)
This is just a housekeeping post to post both presentations I’ve done so far for this project to the blog.