
In this project, I chose to use the PLUTO dataset, a dataset made freely available by NYC’s Department of Urban Planning that includes parameters describing every NYC tax block in terms of its buildings, their physical attributes, as well as their year of establishment. My goals for this projet were to visualize in an animated way the evolution of Manhattan as a collection of building, to give a sense of an emergent order in the way the buildings of New York came to be.
Design

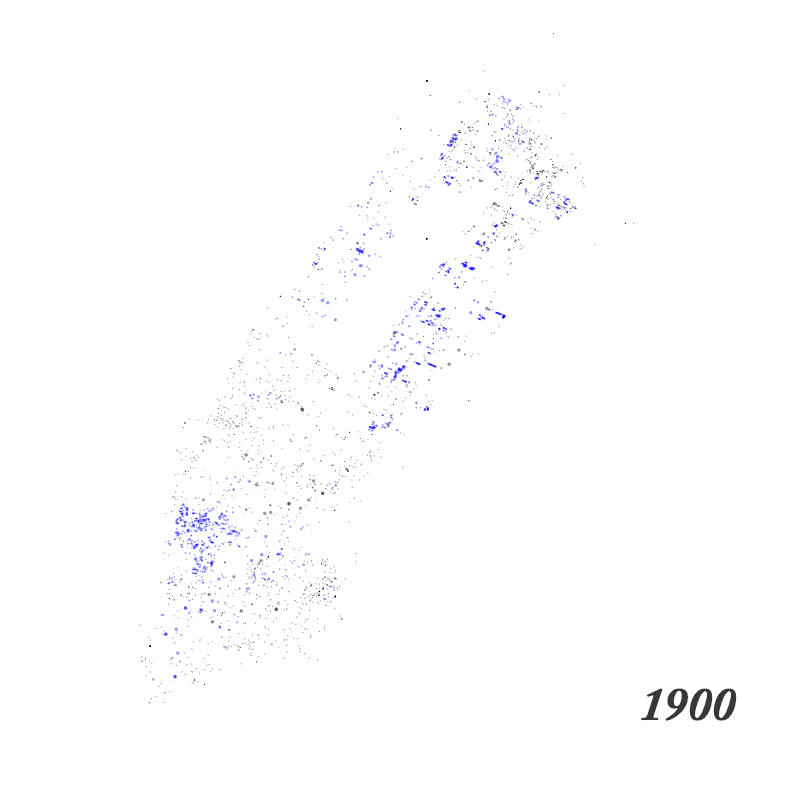
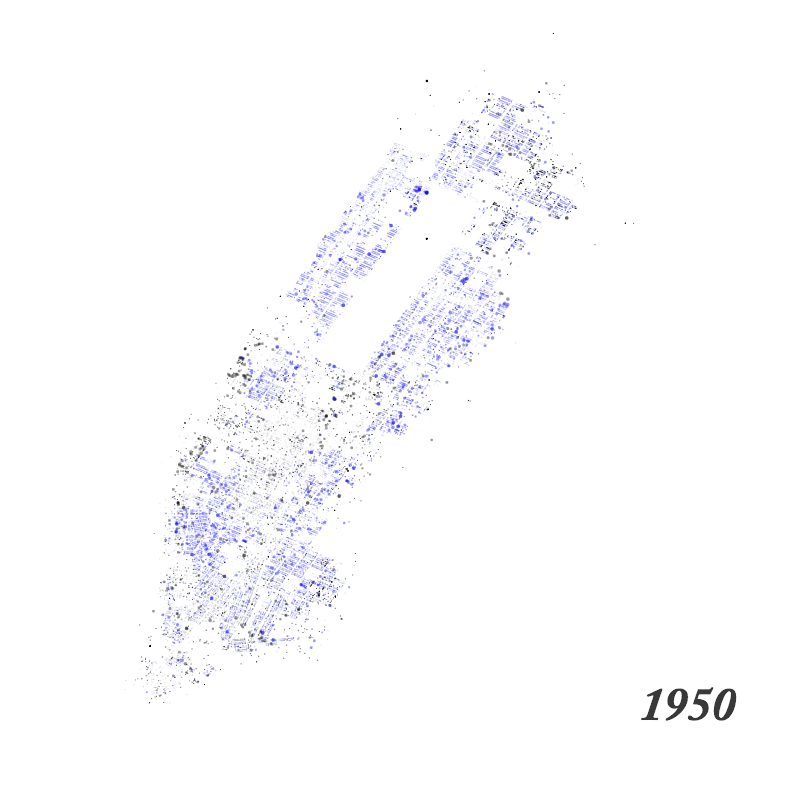
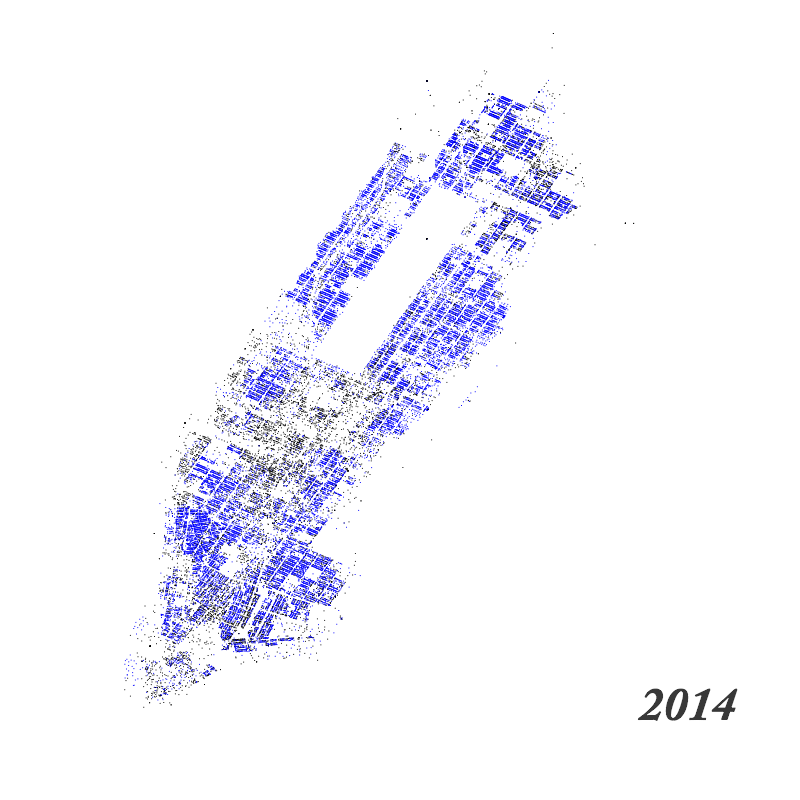
Visually, each building is presented as a colored dot. This is for the practical reason of avoiding slowdown as number of datapoints is large.
An opportunity that the richness of the data and the simplicity of the visual design afforded me is to use color to highlight aspects of the data. After experimentation with a number of color combinations as well as sets of data fields to highlight, I chose to visually emphasize, in yellow, a single aspect of the data: whether the building displayed is a residential or a non-residential one as that, to me, the most interesting categorical data parameters of the datapoints.
The runtime of the application is mapped to the progress of time from 1801 to 2014, with each year is half a second. Whenever a year “occurs,” the buildings whose year of construction is the that year burst into the view, then fade gradually to a predefined alpha value.
As the data is principally cartographical, a way to zoom into particular parts is an important function to have. Therefore the final implementation allowed the use to click into the canvas to zoom into a particular region, and to click escape to reset the view. Other interactions include pressing the arrow keys to control the flow of time forwards and backwards, and the space bar to reset the time to 1800.
[sr_video][/sr_video]
Process
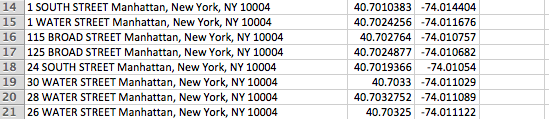
The main shortcoming of the dataset is its lack of GPS parameters. Fortunately, the dataset does include location fields, including the zip code, that can be stringed together to form a coherent address.
To get the actual GPS longitude and latitude of each building, I wrote a Python script that utilizes Google’s geocoding API. However, I soon came to know that there is a limit on the daily number of API calls that I could do from a single IP address, while the number of building I need to geocode is a bit over 43,300. To overcome this, I opted to run the script twice a day, once from my home network and another from the NYU campus network. I was able to get all the data in a bit over a week.
In Processing, the basic structure of the code is the definition of the class Building, which is a simple data holder of each of the loaded buildings, as well as a number of functions to load the building data from the CSV file, progress time, and process user interaction. The Building class, along with holding the data presenting the buildings, also implements methods to draw the building, animate its appearance, and update its alpha value as needed.
Leave a Reply